The Desmos graphing calculator is built into every Digital SAT math question through the Bluebook app – available on all 44 math problems in both modules, with no restrictions on when you open it.
Most students know Desmos exists. Fewer than 20% use it strategically. The gap between knowing the calculator is there and knowing exactly which moves to make in under 30 seconds is where SAT math scores actually separate. This guide covers the full picture: what Desmos genuinely can do on the SAT, where it slows you down, and seven specific techniques with time estimates so you know exactly when to reach for it.
What Desmos Is on the Digital SAT
Desmos is a professional-grade graphing calculator embedded directly into College Board‘s Bluebook testing app. It replaced the need to bring a physical graphing calculator to the exam when the Digital SAT launched in 2024.
You access it by clicking the calculator icon in the Bluebook toolbar during either Math module. Two modes are available: graphing (the default) and scientific. You can switch between them mid-problem.
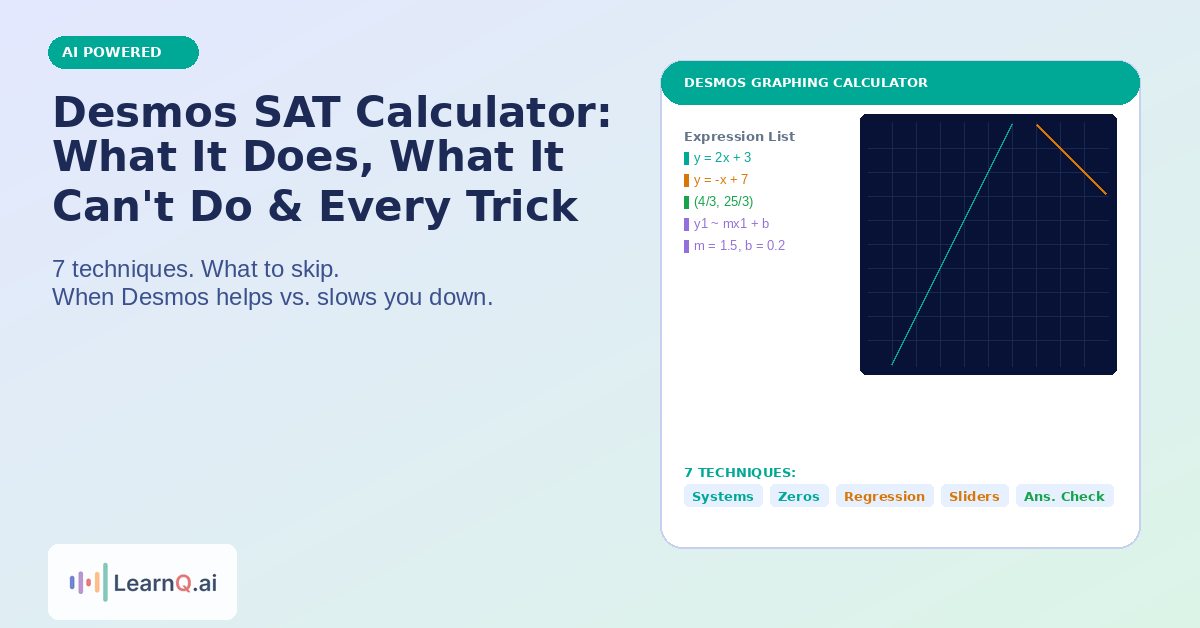
The graphing calculator does everything the scientific calculator does, plus graphing, regression, sliders, and intersection-finding. In almost all cases, staying in graphing mode is the right call.
One important update: College Board banned CAS-capable physical calculators from all SAT administrations starting August 2025. This has no effect on the built-in Desmos, which has never had CAS capability. Students who relied on CAS-enabled physical calculators at home for practice now need to adjust their habits.
What Desmos Can Do: The Core Techniques
These are the question types where Desmos produces the correct answer faster and more reliably than algebra.
Technique 1: Systems of Equations (the single highest-value skill)
Graph both equations and click the intersection point. Desmos labels the coordinates automatically.
Time: 20-30 seconds, including typing.
This applies to linear-linear systems, linear-quadratic systems, and any system where the question asks for the x or y value at the intersection. You do not need to rearrange equations to slope-intercept form first. Desmos accepts standard form (2x + 3y = 12), point-slope, and anything in between.
Technique 2: Finding Zeros and Roots of Functions
Type the function on line 1. Click on the x-intercepts that appear. Desmos labels each zero with its coordinates.
Time: 15-20 seconds.
This is the fastest approach for any question asking “for what value of x does f(x) = 0” or “how many real solutions does this equation have.” For the solution count question type specifically, graphing is often faster than the discriminant formula.
Technique 3: Regression for Data Tables
When a question gives you a table of (x, y) values and asks you to identify the equation type or find a specific coefficient, enter the data as a regression.
Type the x values as a list: x₁ = [1, 2, 3, 4]. Enter the y values as y₁ = [3, 7, 13, 21]. Then type y₁ ~ ax₁² + bx₁ + c for a quadratic regression, or y₁ ~ mx₁ + b for linear.
Desmos instantly shows the coefficient values. This approach eliminates the multi-step system-of-equations algebra that these questions would otherwise require.
Time: 40-60 seconds for initial setup, but saves 2-3 minutes vs. manual algebra.
Note on notation: the tilde (~) is typed with Shift + backtick (the key left of the 1). Using an equals sign (=) instead of tilde causes the regression to silently fail.
Technique 4: Sliders for Parameter Questions
Questions that ask “for what value of k does the equation have exactly one solution” are slider questions in disguise.
Type the equation with k as a variable (Desmos auto-creates a slider), then drag the slider until the graph configuration changes – two intersection points becomes one, or a parabola becomes tangent to the x-axis.
Time: 30-45 seconds.
This is especially powerful on Advanced Math questions where isolating k algebraically requires the discriminant or completing the square. The slider makes it visual.
Technique 5: Checking Answer Choices by Graphing
If the question asks which equation matches a given graph description, type each answer choice and compare the result to what the question describes.
Time: 15-20 seconds per answer choice. With four choices, worst case is 80 seconds – still faster than deriving the equation from scratch on unfamiliar function families.
Technique 6: Evaluating Functions at Specific Values
Type f(x) = [the function], then click on the graph at a specific x-value or type the x-value directly to get the output.
This is useful for questions that give you f(x) and ask for f(3), f(-2), or similar point evaluations where plugging in mentally risks arithmetic errors.
Time: 10-15 seconds.
Technique 7: Visualizing Geometry Constraints
When a problem describes a situation on the coordinate plane without a diagram – distance between two points, circles, midpoints, overlapping regions – entering the equations forces the visual to appear and eliminates interpretation errors.
Type the circle equation: (x-2)² + (y-3)² = 25 shows a circle of radius 5 centered at (2, 3). Add a line. Click intersections.
Time: 30-45 seconds, but eliminates the class of errors that come from misreading a text-only geometry setup.
What Desmos Cannot Do on the SAT
This section matters as much as the tricks. The 2026 SAT includes questions specifically designed to slow down students who reach for Desmos on every problem. The highest scorers treat Desmos as a scalpel, not a default.
| Situation | Why Desmos Slows You Down |
|---|---|
| Single-variable linear equations | x + 5 = 12 is 2-second algebra; typing takes longer |
| Word problems with unit conversion | Desmos graphs don’t simplify unit reasoning |
| Percentage and ratio problems | No visual benefit; straightforward arithmetic is faster |
| Questions where answer choices are exact fractions | Desmos gives decimals; matching back to fractions costs time |
| Problems with messy non-integer coefficients | Graph visuals become ambiguous; intersection coordinates hard to read |
| Reading the graph the question already provides | The question has a graph – no need to recreate it |
The 15-second rule: before opening Desmos, ask whether the problem has two or more equations or functions interacting. If yes, Desmos almost always helps. If it is a single-expression calculation or unit conversion, close the calculator and do it mentally or with scratch work.
Desmos in Hard Module 2: Why It Matters More There
Understanding how adaptive testing works changes how you think about Desmos. If you route to Hard Module 2 based on strong Module 1 performance, the math questions escalate in complexity. The problems in Hard Module 2 are specifically designed to reward strategic calculator use over algorithmic recall.
Harder questions tend to involve more interacting equations, less obvious entry points for algebraic approaches, and parameters that require visual reasoning. This is exactly where Desmos’s techniques – regression, sliders, intersection-finding – deliver the biggest time savings.
Read the Digital SAT Module 1 strategy guide for the full framework on routing decisions. But the short version: being skilled enough with Desmos to use it confidently in Hard Module 2 is what separates 1400 scores from 1500 scores on the math section.
The SAT Desmos Interface: What Is Different From Regular Desmos
The version embedded in Bluebook has minor layout differences from desmos.com that trip up students who only practised on the public website.
In the Bluebook version, the graphing area occupies the main screen, the expression list appears on the left side, and the keyboard icon is in the bottom-left corner. On desmos.com, the expression list is also on the left but the interface proportions differ.
The functional capabilities are identical: same regression syntax, same slider behavior, same intersection-finding. Practice on desmos.com builds the right habits, but run at least two full SAT math practice sessions inside the actual Bluebook app before test day to get comfortable with the layout under timed conditions.
Using the Scientific Mode
The graphing calculator handles everything the scientific calculator can – and more – so staying in graphing mode for the entire exam is the standard recommendation.
The one exception is if a problem involves factorials, permutations, or combinations (the nCr / nPr functions). These appear in the scientific mode’s keyboard and are slightly faster to access there than through the graphing keyboard. If you see a counting problem that requires 8C3 or similar, switching to scientific mode for 20 seconds is worth it.
How to Practice Desmos Before Test Day
The fastest improvement path is technique-specific drilling rather than general practice.
Pick one technique from this guide each practice session. Spend 15 minutes finding 5-8 questions in SAT math practice that fit that technique. Use Desmos for every one. Time yourself.
Once each technique takes under 30 seconds consistently, drill mixed sets where you identify which technique to use before opening Desmos. The identification step – asking “what type is this?” – is the habit that produces score gains on the actual exam.
Review the SAT math formulas alongside your Desmos practice. Some Advanced Math questions require you to know the formula to set up the right equation before Desmos can solve it. Desmos is a tool for executing calculations – it does not replace knowing what calculation to perform.
LearnQ.ai’s adaptive practice library includes question sets tagged by technique type, so you can drill Desmos-relevant question types directly. Mia, LearnQ’s AI tutor, identifies which Desmos techniques are costing you points based on your error history and builds your next session around closing those specific gaps.
FAQ
Is Desmos available on every SAT question?
Desmos is available on all 44 math questions across both modules. There is no calculator-free section on the Digital SAT. However, this does not mean you should use Desmos on every question – many problems are faster with mental math or scratch work.
Can I use Desmos on the SAT Reading and Writing section?
No. Desmos is only accessible during the Math modules. The Reading and Writing section has no calculator access at all.
Is the SAT version of Desmos the same as desmos.com?
The functional capabilities are identical – same graphing, regression, sliders, and intersection-finding. The layout differs slightly in Bluebook: the expression list is on the left and the keyboard is in the bottom-left corner. Practice on desmos.com builds accurate habits, but run sessions in Bluebook before test day to get comfortable with the specific interface.
How do I zoom in on Desmos on the SAT?
Double-click on the area you want to zoom into in the graphing panel. This zooms directly to that point without using the +/- buttons. You can also use the +/- zoom controls in the upper-right corner. To return to the default view, click the home button below the zoom controls.
What happened to the CAS calculator on the SAT?
College Board banned CAS-capable physical calculators from all SAT administrations starting August 2025. The built-in Desmos calculator was never CAS-capable, so this ban only affects students who previously brought CAS-enabled physical graphing calculators (such as the TI-Nspire CX CAS) to test centers. The Desmos interface in Bluebook is unchanged.
Does Desmos help with the hardest SAT math questions?
Yes, significantly. The hardest Digital SAT math questions appear in Hard Module 2 and typically involve interacting equations, parameter sliders, or regression – the exact scenarios where Desmos techniques save the most time. Students who master the Hard Module 2 routing strategy and pair it with confident Desmos use consistently see the largest score jumps on the math section.
Can I type equations in any form into Desmos?
Yes. Desmos accepts slope-intercept form (y = 2x + 3), standard form (2x + 3y = 12), point-slope, and most other common equation forms. You do not need to rearrange equations before entering them, which is one of the biggest time savings the tool offers.
Should I always use graphing mode, or should I switch to scientific?
Stay in graphing mode for nearly all problems. The one case where switching to scientific makes sense is for counting problems involving factorials, permutations, or combinations (nCr / nPr notation) – the scientific keyboard makes these marginally faster to access.
Sources: College Board Digital SAT calculator policy (2026); Acely SAT Desmos Cheat Sheet (June 2026); The Test Advantage Desmos Guide (June 2026); Edushaale SAT Calculator Section analysis (May 2026)
The LearnQ Editorial Team is made up of certified Digital SAT tutors, college admissions specialists, and AI education researchers. Our tutors have personally helped over 10,000 US high school students improve their SAT scores, with an average improvement of 150+ points. We combine hands-on tutoring expertise with AI-powered insights from the LearnQ platform, which has analyzed millions of Digital SAT practice questions. Every article we publish is reviewed against the latest College Board Bluebook guidelines and cross-checked with real student performance data. Our mission is simple: give every student the same quality of prep that was once only available at expensive tutoring centers.