

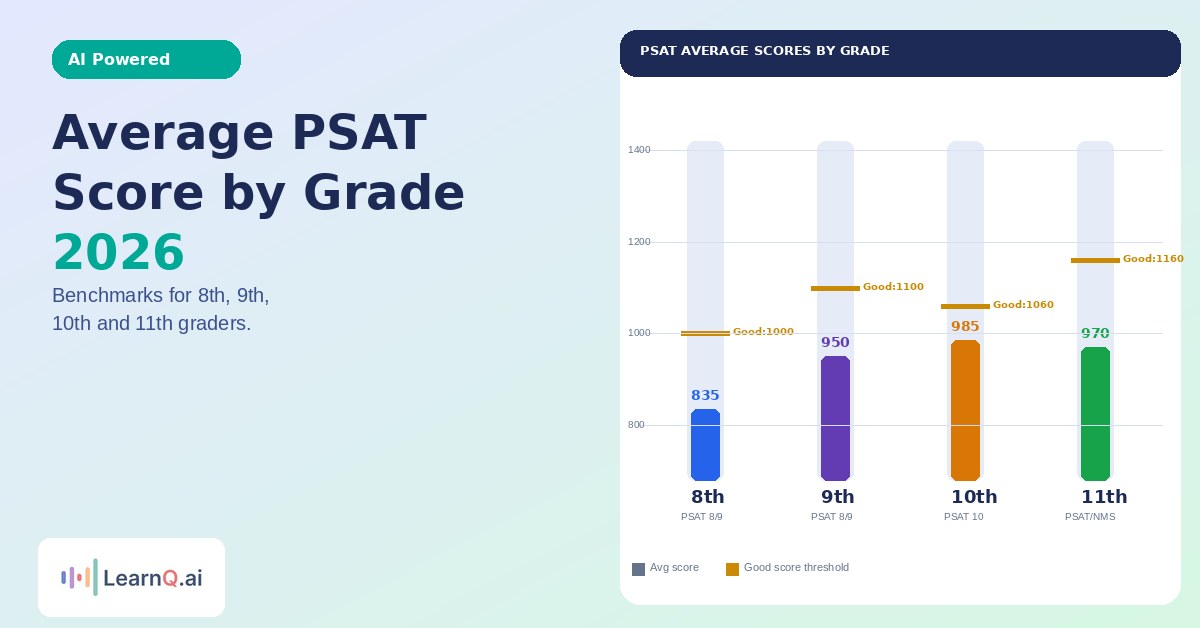
Average PSAT scores in 2026: roughly 800-870 for 8th graders, 900-1000 for 9th graders, 920-1020 for 10th graders, and 930-1010 for 11th graders. “Good” means something different at each grade because the comparison group changes and because the stakes change – only your 11th-grade PSAT/NMSQT score qualifies you for National Merit scholarships.
If you just got your PSAT score back and want to know whether it is good, the first question to ask is not “what did I score?” but “what grade am I in?” A 950 in 8th grade puts you well ahead of your peers. A 950 in 11th grade falls around the 30th percentile and signals there is significant room to improve before the SAT. The same number means very different things depending on where you are in school.
This guide covers average scores and percentile benchmarks for each grade, what “good,” “great,” and “National Merit” ranges look like at each level, College Board’s official readiness benchmarks, how to connect your PSAT score to your SAT target, and what to do next based on where you landed.
The Three PSAT Tests: Which One Are You Taking?
Before looking at average scores, you need to know which version of the PSAT applies to your grade, because they have different score scales.
| PSAT Version | Who Takes It | Score Range | National Merit? |
|---|---|---|---|
| PSAT 8/9 | 8th and 9th graders | 240-1440 | No |
| PSAT 10 | 10th graders | 320-1520 | No |
| PSAT/NMSQT | 10th and 11th graders | 320-1520 | 11th grade only |
The PSAT 8/9 has a lower maximum score (1440 vs 1520) because it is designed for younger students. When comparing a PSAT 8/9 score to a PSAT 10 or PSAT/NMSQT score, the scales are not identical – you are not missing 80 points of “room,” you are on a genuinely different instrument.
The PSAT 10 and PSAT/NMSQT are nearly identical in content and scored on the same 320-1520 scale. The only practical difference is that only the PSAT/NMSQT taken in 11th grade in October qualifies students for the National Merit Scholarship Program. Taking the PSAT/NMSQT as a 10th grader provides useful practice data but does not create any National Merit eligibility.
Average PSAT Score for 8th Graders (PSAT 8/9)
Average range: 800-870 total
Scale: 240-1440
What matters at this grade: Diagnostic value only. No National Merit implications, no college reporting, no stakes.
The PSAT 8/9 in 8th grade is the lowest-stakes standardized test most students will ever take. The primary purpose is diagnostic – identifying where you are in reading, writing, and math before high school begins. Scores are not reported to colleges and have no bearing on anything except giving you and your parents a baseline to plan from.
What the score ranges mean for 8th graders:
| Total Score | Percentile (approx.) | What It Signals |
|---|---|---|
| Below 750 | Below 25th | Foundational skills to develop before 9th grade |
| 750-870 | 25th-50th | Average for the grade; solid starting point |
| 870-1000 | 50th-75th | Above average; strong foundation for high school |
| 1000-1100 | 75th-90th | Very strong for an 8th grader |
| 1100+ | Top 10% | Exceptional for grade level |
At 8th grade, the most useful thing to do with your score is identify which question types produced the most errors and build those skills before 9th grade. The specific question types are more actionable than the total score at this stage.
Average PSAT Score for 9th Graders (PSAT 8/9)
Average range: 900-1000 total
Scale: 240-1440
What matters at this grade: Still diagnostic; sets the baseline for your National Merit window in 11th grade.
9th graders taking the PSAT 8/9 are two years out from the PSAT/NMSQT that counts for National Merit. This makes the 9th-grade score genuinely useful for planning: if you score 950 as a freshman, you have a concrete baseline to work from as you target 1200+ or 1400+ in 11th grade.
What the score ranges mean for 9th graders:
| Total Score | Percentile (approx.) | What It Signals |
|---|---|---|
| Below 850 | Below 25th | Below average for 9th grade; focus on foundational skills |
| 850-1000 | 25th-50th | Average range; typical for most 9th graders |
| 1000-1100 | 50th-75th | Above average; on a strong trajectory for 11th grade |
| 1100-1200 | 75th-90th | Top quartile; National Merit range is realistic with continued improvement |
| 1200-1280+ | Top 10% and above | Exceptional for a 9th grader |
For context: a student scoring 1000 in 9th grade who improves an average of 50-100 points per year will likely hit 1100-1200 by 11th grade – right around or above the 75th percentile for the PSAT/NMSQT. Students at 1100 in 9th grade are already competitive for National Merit territory with sustained effort.
A 9th-grade PSAT score is your earliest meaningful signal of where you are relative to the Digital SAT’s content areas. The 9th-grade score report’s section breakdowns tell you far more than the total: which R&W question types and which Math domains need development over the next two years.
Average PSAT Score for 10th Graders (PSAT 10 or PSAT/NMSQT)
Average range: 920-1050 total
Scale: 320-1520
What matters at this grade: First major benchmark on the 1520 scale; important prep signal for 11th-grade National Merit attempt.
10th grade is where PSAT scores start to matter more strategically. You are one year away from the PSAT/NMSQT that qualifies for National Merit, and your 10th-grade score gives you concrete data to build a gap-closing plan. College Board sets specific Academic Readiness Benchmarks for 10th graders.
College Board official benchmarks for 10th grade (PSAT 10):
- Reading and Writing section: 430 (out of 760)
- Math section: 420 (out of 760)
- Total benchmark: 850
Meeting these benchmarks means you are on track for college-level coursework. Falling below them does not mean college is out of reach, but it signals that specific content areas need attention before 11th grade.
What the score ranges mean for 10th graders:
| Total Score | Percentile (approx.) | What It Signals |
|---|---|---|
| Below 850 | Below 25th | Below College Board benchmark; targeted prep needed |
| 850-1000 | 25th-45th | Meets or approaches benchmark; average range |
| 1000-1060 | 45th-75th | Above average; 75th percentile is around 1060 |
| 1060-1180 | 75th-90th | Strong performance; top quartile for sophomores |
| 1180-1370+ | 90th-99th | Exceptional; National Merit range is realistic with good 11th-grade performance |
The 10th-grade score and National Merit trajectory:
A 10th-grade PSAT/NMSQT score of 1060 puts you roughly at the 75th percentile for sophomores. The typical National Merit Semifinalist cutoff for most states requires a Selection Index equivalent to a PSAT/NMSQT total score of roughly 1400-1450 for 11th graders. If you scored 1060 as a sophomore, closing a 340-390 point gap in one year is aggressive but not uncommon with structured prep – students in dedicated programs regularly see 150-250 point gains between 10th and 11th grade PSAT attempts.
If you scored above 1200 as a 10th grader, you are already in serious National Merit territory and should begin targeted prep to push into the 1400+ range for 11th grade.
Average PSAT Score for 11th Graders (PSAT/NMSQT)
Average range: 930-1010 total
Scale: 320-1520
What matters at this grade: Everything. This is the only PSAT score that qualifies for National Merit. It is also your strongest SAT predictor.
The 11th-grade PSAT/NMSQT is the only version of the PSAT with real stakes: it determines National Merit eligibility, and your score report gives you the most accurate pre-SAT diagnostic you will ever receive.
College Board official benchmarks for 11th grade (PSAT/NMSQT):
- Reading and Writing section: 460 (out of 760)
- Math section: 510 (out of 760)
- Total benchmark: 970
Meeting the 11th-grade benchmark (970) suggests you are on track for college-level coursework. This is the minimum meaningful target for 11th-grade test-takers.
What the score ranges mean for 11th graders:
| Total Score | Percentile (approx.) | What It Signals |
|---|---|---|
| Below 870 | Below 25th | Below average; focused SAT prep is urgent |
| 870-1010 | 25th-50th | Below to at average; 930-940 is roughly the 50th percentile |
| 1010-1160 | 50th-75th | Above average; solid platform for SAT improvement |
| 1160-1370 | 75th-90th | Strong; 1160 is ~75th, 1250 is top 25%, 1370 is ~90th |
| 1370-1520 | 90th-99th+ | National Merit range; 1400+ is competitive for most states |
The 50th percentile for 11th graders is approximately 930-940. If you scored around 1000, you are above average. If you scored 1200, you are in the top 25%. If you scored 1400+, you are in the range where National Merit Semifinalist status becomes realistic depending on your state.
National Merit Score Requirements by State (2026 Estimates)
National Merit eligibility is determined by the Selection Index, not your PSAT total score. The Selection Index formula is:
Selection Index = 2 x (R&W Section Score + Math Section Score) divided by 10
Actually more precisely: Selection Index = (Reading Test Score + Writing and Language Test Score + Math Test Score) x 2, where each test score is on a scale of 8-38. The result ranges from 48 to 228.
Estimated 2026 Semifinalist cutoffs by state competitiveness:
| State Competitiveness | Estimated Selection Index | Approx. PSAT Total Equivalent |
|---|---|---|
| Most competitive (CA, NY, MA, NJ, TX, MD, CT) | 220-223 | ~1400-1440 |
| Moderately competitive | 212-220 | ~1360-1400 |
| Less competitive | 205-212 | ~1310-1360 |
These are estimates based on historical patterns. College Board does not publish official cutoffs in advance – actual cutoffs are announced after testing.
The critical insight about National Merit: a student with a 1390 PSAT total but balanced section scores often outperforms a student with a 1410 total where one section is significantly stronger than the other, because the Selection Index weights both sections equally. Section balance matters as much as total score for National Merit purposes.
How to Convert Your PSAT Score to a Predicted SAT Score
The PSAT/NMSQT and Digital SAT share the same content format, adaptive testing structure, and question types. College Board designs the PSAT specifically to predict SAT performance.
The conversion is straightforward: PSAT scores and SAT scores are on similar but not identical scales (PSAT tops at 1520, SAT tops at 1600). Most students score roughly 30-80 points higher on their SAT than their PSAT in the same prep period, because:
- The SAT has additional hard questions at the upper end of the scale that the PSAT does not include
- Students who prepare specifically for the SAT after their PSAT gain more than that typical range
PSAT to SAT rough conversion table:
| PSAT Total (11th Grade) | Projected SAT Range | Typical Applicability |
|---|---|---|
| Below 900 | 900-1000 | Below average; intensive prep needed |
| 900-1000 | 1000-1100 | Below average SAT; strong improvement possible |
| 1000-1100 | 1100-1200 | Average SAT range |
| 1100-1200 | 1200-1320 | Competitive for many schools |
| 1200-1300 | 1300-1400 | Strong for selective schools |
| 1300-1400 | 1380-1480 | Very competitive; top-20 school range |
| 1400+ | 1450-1550+ | National Merit / highly selective range |
These projections assume preparation between the PSAT and SAT. With dedicated prep focused on weak question types, students regularly outperform these projections by 50-150 points. See the improve SAT score by 200 points guide for the structured approach.
What to Do With Your Score, Grade by Grade
8th and 9th grade: use the score report, not the total
At these grade levels, the most productive response to your PSAT score is to ignore the total for a moment and focus on the section breakdowns. Your score report shows which R&W question types (Transitions, Words in Context, Command of Evidence, etc.) and which Math domains (Algebra, Advanced Math, Data Analysis) produced the most errors. These breakdowns define exactly what to develop over the next 1-3 years before the score actually matters.
Understanding how the SAT questions are structured at this stage – the Digital SAT question types guide gives a useful introduction to R&W question categories – builds the vocabulary you need to interpret your score report meaningfully.
10th grade: close the benchmark gap and set a 11th-grade target
If your 10th-grade score fell below 850 (College Board’s readiness benchmark), that is the primary target: build the content foundations that are currently weak. If you met or exceeded 850, your target for 11th grade should be 1200+ (top 25%) or higher, depending on your National Merit aspirations.
10th grade is also the right time to take a full-length practice test to confirm your score report data and begin regular SAT/PSAT practice. The Bluebook practice test accuracy guide explains which practice tests best predict your real performance at the 10th-grade level.
LearnQ.ai’s free 45-minute diagnostic identifies your specific weak question types across R&W and Math – giving you the same targeting data as a full PSAT score report in half the time.
11th grade: prioritize the SAT, not the PSAT retake
A common mistake 11th graders make after getting their PSAT/NMSQT score is focusing energy on whether to retake the PSAT rather than shifting focus to the SAT. The PSAT/NMSQT is offered once per year in October. If you took it in October of 11th grade, your result is final for National Merit purposes. There is no PSAT retake in the spring of 11th grade that affects National Merit eligibility.
The correct next step for most 11th graders after getting their PSAT/NMSQT score: use the score report to identify your weakest 2-3 question types, begin targeted SAT prep around those types, and register for the SAT (first available date is typically December or March). The Digital SAT Module 1 strategy guide explains how the adaptive format works and how your question type accuracy in Module 1 determines your score ceiling – knowledge that applies equally to PSAT prep for 10th graders and SAT prep for 11th graders.
See the SAT retake guide for the framework to decide when and how many times to attempt the SAT after your 11th-grade PSAT result.
If you are comparing your PSAT score to potential ACT performance, the SAT to ACT score conversion chart maps your PSAT/NMSQT projection to an ACT equivalent – useful for deciding whether to attempt both tests.
Grade-by-Grade Summary Table
| Grade | Test | Average Score | Meets Benchmark | Good Score | Great Score | National Merit Range |
|---|---|---|---|---|---|---|
| 8th | PSAT 8/9 | 800-870 | N/A | 870-1000 | 1000+ | N/A |
| 9th | PSAT 8/9 | 900-1000 | N/A | 1000-1100 | 1100+ | N/A |
| 10th | PSAT 10 / NMSQT | 920-1050 | 850+ | 1060-1180 | 1180+ | N/A (not eligible) |
| 11th | PSAT/NMSQT | 930-1010 | 970+ | 1160-1250 | 1250+ | 1400+ (state-dependent) |
Source: College Board percentile data; IvyStrides 2026 analysis; Num8ers PSAT score guide 2026.
Quick Diagnostic: How to Read Your Score Report
When your PSAT score arrives (typically 4-6 weeks after testing via your College Board account), the total score is less useful than these three things:
1. Section scores separately: Your R&W score and Math score tell you where your imbalance is. National Merit Selection Index is calculated from individual section subscores – a balanced 700/680 is often better for the Selection Index than a 760/620 total despite the same total score.
2. Question type breakdown: Your score report shows performance by domain (Information and Ideas, Craft and Structure, etc. for R&W; Algebra, Advanced Math, etc. for Math). This is the data that drives your prep plan.
3. Academic benchmark status: Green/yellow/red benchmark indicators tell you whether you are meeting, approaching, or below the College Board’s grade-level college-readiness target. Yellow or red means targeted work is needed in that section.
LearnQ.ai’s free full-length practice test produces a question-type breakdown that mirrors the PSAT score report structure – useful for tracking improvement between your PSAT and your SAT. Start free on LearnQ’s Digital SAT platform. View all plans to see what is included.
For context on how your score percentile compares nationally across all test-takers, see the SAT score percentile guide – the percentile framework is the same across the PSAT and SAT families.
FAQ
What is the average PSAT score by grade in 2026?
Average PSAT scores in 2026 are approximately 800-870 for 8th graders (PSAT 8/9 scale of 240-1440), 900-1000 for 9th graders (same scale), 920-1050 for 10th graders (PSAT 10 scale of 320-1520), and 930-1010 for 11th graders (PSAT/NMSQT scale of 320-1520). Scores increase with grade because older students have covered more curriculum. According to College Board’s percentile tables, the 50th percentile for 11th graders is approximately 930-940.
What is a good PSAT score for a 10th grader?
A good PSAT score for a 10th grader is 1060 or above, which puts you around the 75th percentile. College Board’s college readiness benchmark for 10th graders is 850 (430 R&W + 420 Math). Meeting or exceeding 850 means you are on track for college-level coursework. Scores above 1180 are exceptional for sophomores and put you in the top 10%. Since 10th-grade scores do not count for National Merit, the most important use of your 10th-grade result is to identify weak areas and build toward 1200+ in 11th grade.
What is a good PSAT score for an 11th grader?
A good PSAT/NMSQT score for an 11th grader is 1160 or above (approximately the 75th percentile). College Board’s college readiness benchmark is 970 (460 R&W + 510 Math). For National Merit Semifinalist consideration, most states require scores equivalent to roughly 1400-1450, though exact cutoffs vary by state and are determined by a Selection Index rather than the total score directly.
What PSAT score do you need for National Merit?
National Merit eligibility is determined by the Selection Index, not your PSAT total score. The Selection Index ranges from 48-228 and is calculated from your individual test scores. For 2026, estimated Semifinalist cutoffs range from approximately 205-223 depending on state. Highly competitive states (California, New York, Massachusetts, New Jersey) typically require Selection Index scores of 220-223, equivalent to a PSAT total of roughly 1400-1440. Less competitive states may qualify with 205-212. Only your 11th-grade PSAT/NMSQT score counts – freshman and sophomore scores have no National Merit implications.
What is a good PSAT score for a 9th grader?
For 9th graders taking the PSAT 8/9, a good score is 1000 or above (roughly the 50th-75th percentile range for the grade). A score of 1100+ is very strong and puts you in the top quartile. Since the PSAT 8/9 does not count for National Merit and colleges never see it, the most valuable use of your 9th-grade score is as a 2-year baseline: identify weak areas now and build toward a competitive 11th-grade PSAT/NMSQT score.
Do colleges see your PSAT score?
No. Colleges do not receive your PSAT scores unless you choose to share them or you win a National Merit scholarship (in which case your recognition is noted in your application). The PSAT is specifically designed as a low-stakes practice test that does not affect college applications. This makes it valuable: you can see exactly where you stand and what needs improvement without any admissions consequence.
How do I check my PSAT score?
Log in to your College Board account at studentscores.collegeboard.org. PSAT/NMSQT scores are typically available 4-6 weeks after the October test date. PSAT 8/9 and PSAT 10 score timelines vary by school. College Board also sends an email notification when your scores are ready. If your school administers the test, you can also ask your school counselor for a PDF of your score report.
Sources: College Board PSAT/NMSQT overview; College Board PSAT percentile tables; IvyStrides good PSAT score guide 2026 (ivystrides.com, March 2026); Num8ers PSAT score calculator and guide 2026 (num8ers.com); Road2College PSAT score guide (road2college.com, December 2025)

The LearnQ Editorial Team is made up of certified Digital SAT tutors, college admissions specialists, and AI education researchers. Our tutors have personally helped over 10,000 US high school students improve their SAT scores, with an average improvement of 150+ points. We combine hands-on tutoring expertise with AI-powered insights from the LearnQ platform, which has analyzed millions of Digital SAT practice questions. Every article we publish is reviewed against the latest College Board Bluebook guidelines and cross-checked with real student performance data. Our mission is simple: give every student the same quality of prep that was once only available at expensive tutoring centers.