

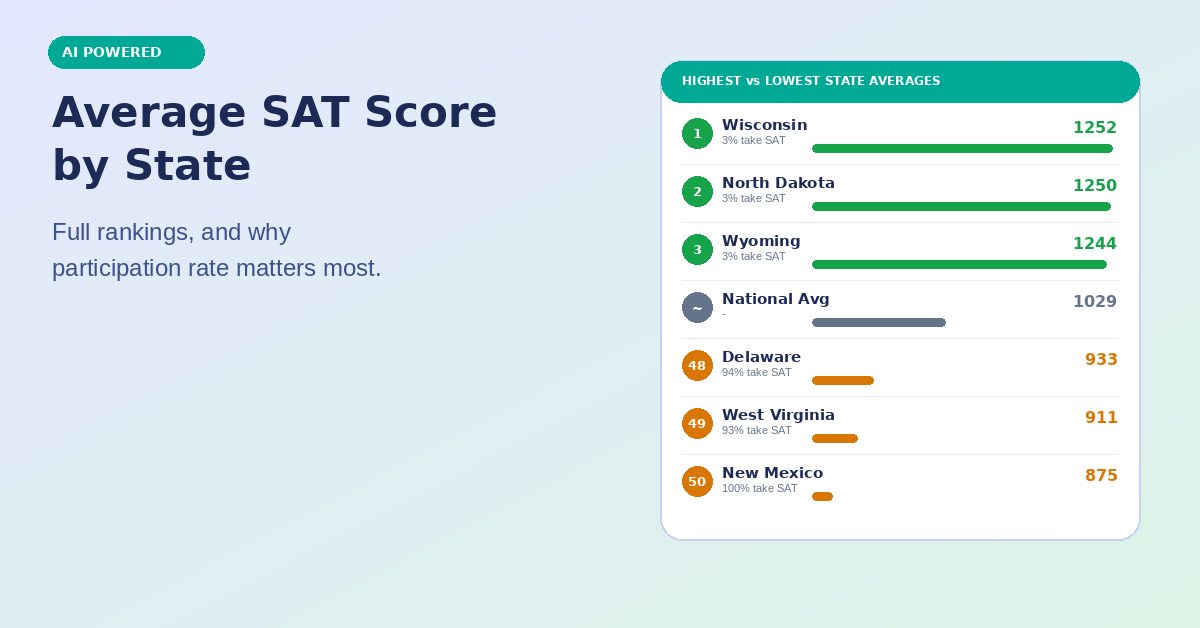
The national average SAT score for the Class of 2025 is 1029 (521 Reading and Writing, 508 Math), but state averages swing from under 900 to over 1250. That 350-plus point gap is driven almost entirely by one factor: how many students in each state actually take the SAT, not how prepared they are.
If you are comparing your SAT score to your state’s average, the number alone can be misleading. A 1050 in a state where every graduating senior takes the SAT is a genuinely stronger relative performance than a 1200 in a state where only the top 3% of students opt in. This guide ranks states by average score, shows participation rate side by side so the comparison makes sense, and explains exactly what drives the pattern.
Why State Averages Vary So Much: Participation Rate
Every state-level SAT dataset shows the same pattern: states with the highest average scores almost always have the lowest participation rates, and states with the lowest average scores almost always have the highest participation rates.
This happens because of who actually shows up to take the test. In states where the SAT is mandatory for all public high school juniors (often as a school-day test paid for by the state), the average reflects the entire student population – strong students, average students, and students who have no intention of attending a four-year college. In states where the SAT is optional and the ACT is the dominant regional test, only self-selected, typically college-bound and better-prepared students choose to sit for the SAT at all – which mechanically inflates that state’s average, even though it says nothing about the overall academic strength of students in that state.
The rule of thumb: states with SAT participation under 10% almost always rank in the top 10 nationally by average score. States with participation over 90% almost always rank in the bottom 10. This is true nearly without exception across the current data.
Highest Average SAT Scores by State
These states show the pattern clearly – very low participation, very high average score, because only the most motivated and prepared students are choosing to test.
| State | Average SAT Score | Participation Rate |
|---|---|---|
| Wisconsin | ~1252 | 2-3% |
| North Dakota | ~1250 | 2-3% |
| Wyoming | ~1244 | 3% |
| Kansas | ~1238 | 4% |
| Utah | ~1233 | 4% |
| Mississippi | ~1226 | 3% |
| Minnesota | ~1225 | 3% |
| Nebraska | ~1222 | 3% |
| Kentucky | ~1219 | 4% |
| South Dakota | ~1219 | 3% |
Montana, Tennessee, and Missouri also post averages above 1200, with similarly low participation rates in the low single digits. In every one of these states, the ACT is the dominant college-entrance test – the students who take the SAT instead are a small, self-selected group typically applying to out-of-state or highly selective schools where the SAT carries specific weight.
Lowest Average SAT Scores by State
These states show the opposite pattern – very high participation (often mandatory statewide testing), which pulls the average down because the entire student population is represented, not just college-bound students.
| State | Average SAT Score | Participation Rate |
|---|---|---|
| New Mexico | ~875 | ~100% |
| West Virginia | ~911 | ~93% |
| Delaware | ~933 | ~94% |
| Rhode Island | ~935 | ~99% |
| Indiana | ~950 | ~100% |
| Michigan | ~953 | ~100% |
| Illinois | ~981 | high |
| Florida | ~983 | high |
| District of Columbia | ~985 | high |
Important context: a lower average in these states is not evidence of weaker schools or less capable students. It reflects a fundamentally different testing population – the entire graduating class rather than a self-selected subset. A student scoring 1050 in New Mexico, for example, is performing well above that state’s average and likely sits at a stronger percentile than the raw number suggests when compared only to national figures.
How to Actually Use This Data
Compare your score to your state’s average only with participation rate in view. A score that beats a high-participation state’s average by 100+ points reflects real, strong performance relative to your actual peer group – your graduating class, not a self-selected national pool. See the SAT score percentile guide for how your score compares to all test-takers nationally, which is usually the more meaningful benchmark for college admissions purposes regardless of your state.
Colleges know this pattern too. Admissions officers are well aware that a “strong” score in a high-participation state and an “average” score in a low-participation state can reflect similarly capable students. Most colleges contextualize scores against school and regional data during review, not against a flat national or state number in isolation.
If you want a deeper single-state breakdown, see the Idaho SAT score and college rankings guide for an example of how this data plays out for one specific state’s students and in-state college targets. For the overall national trend and how the average has shifted with test-optional policies and the move to the Digital SAT, see the complete average SAT score guide.
What Counts as a Good Score, Regardless of State
Since state comparisons are heavily distorted by participation rate, the more reliable benchmark for most students is the national percentile, not the state average.
- Above 1030: roughly average nationally (50th percentile)
- Above 1200: top 25% nationally – competitive for most public universities
- Above 1350: top 10% nationally
- Above 1400: top 6% nationally – competitive for highly selective colleges
See the is 1450 a good SAT score guide for a detailed breakdown at the higher end of the scale, and if you are specifically tracking PSAT performance toward National Merit consideration, the National Merit Scholarship guide covers how state-by-state cutoffs work for that separate, PSAT-based competition.
Improving Your Score, Wherever You’re Starting From
State averages are useful context, but they are not a target. Whether your state’s average is 900 or 1250, the path to a stronger score is the same: identify your specific weak question types and drill them deliberately, rather than studying broadly or fixating on a state or national number.
Take LearnQ’s free 40-minute diagnostic to see exactly where you stand and which question types are costing you the most points, regardless of your state’s average. Use LearnQ’s Digital SAT score calculator to understand exactly how raw performance translates to your scaled score. Mia, LearnQ’s AI tutor, builds a study plan targeted at your specific gaps rather than generic state benchmarks. Take a free full-length practice test on LearnQ’s Digital SAT platform to track real progress over time.
Frequently Asked Questions
What is the average SAT score by state in 2026?
State averages for the most recent reporting cycle (Class of 2025) range from around 875 in New Mexico to roughly 1252 in Wisconsin, against a national average of 1029. The wide range is driven almost entirely by participation rate: states with mandatory or near-universal SAT testing report lower averages because the entire student population is included, while states with low participation (often ACT-dominant regions) report higher averages because only a self-selected, typically stronger group of students opts in.
Why do some states have much higher average SAT scores than others?
Participation rate is the primary driver. States where nearly all students take the SAT – often because it is administered as a mandatory school-day test – report lower averages, since the full range of student ability is represented. States where the SAT is optional and few students take it (often because the ACT is the regional standard) report higher averages, since only the most college-focused and typically higher-performing students choose to test.
Which state has the highest average SAT score?
Wisconsin and North Dakota consistently rank at or near the top with averages around 1250, both with participation rates in the low single digits. Wyoming, Kansas, Utah, and several other states with similarly low participation also post averages above 1200.
Which state has the lowest average SAT score?
New Mexico consistently reports the lowest average SAT score, around 875, with SAT participation near 100% – meaning virtually every graduating student takes the test, not just those planning to attend a four-year college. West Virginia, Delaware, and Rhode Island follow with similarly high participation and lower averages.
Is a low state average a bad sign for that state’s schools?
No. A low state average in isolation says very little about school quality, since it primarily reflects near-universal testing rather than weaker instruction. States with 90%+ participation are testing their entire graduating class, including students who have no plans to attend a four-year college, which mechanically pulls the average down regardless of how well local schools are performing.
Should I compare my SAT score to my state average or the national average?
The national percentile is generally the more meaningful benchmark for college admissions purposes, since it is not distorted by your specific state’s participation rate. Your state average is useful context for understanding your relative position among other test-takers physically located in your state, but colleges evaluate applicants against national and regional percentiles far more than against a raw state average number.
Where does this state-level SAT data come from?
State-level averages are compiled from the College Board’s SAT Suite of Assessments Annual Report, published annually and covering the most recently graduated class. The College Board typically releases updated figures each fall, so “current year” figures generally reflect the most recently completed graduating class rather than the class currently in high school.
Sources: College Board SAT Suite of Assessments Annual Report; World Population Review SAT scores by state (worldpopulationreview.com, 2026); Larry Learns average SAT score by state full rankings (larrylearns.com, June 2026); CollegeHelpGuide average SAT scores by state (collegehelpguide.com, March 2026); Empowerly average SAT scores by state guide (empowerly.com, May 2026)

The LearnQ Editorial Team is made up of certified Digital SAT tutors, college admissions specialists, and AI education researchers. Our tutors have personally helped over 10,000 US high school students improve their SAT scores, with an average improvement of 150+ points. We combine hands-on tutoring expertise with AI-powered insights from the LearnQ platform, which has analyzed millions of Digital SAT practice questions. Every article we publish is reviewed against the latest College Board Bluebook guidelines and cross-checked with real student performance data. Our mission is simple: give every student the same quality of prep that was once only available at expensive tutoring centers.