PSAT Math Practice Test Problems

PSAT Math Practice Test Problems

When preparing for the PSAT, one of the most critical sections to focus on is math. Your performance in this section can significantly impact your overall score as an essential building block for SAT preparation and future college admissions. 


By tackling various math practice test problems, you can sharpen your algebra, advanced math, geometry, and data analysis skills, all while boosting your confidence for test day. 


This blog will provide a series of PSAT math practice problems across different topics, helping you master the key concepts needed to excel. 

Key Types of PSAT Math Problems

The PSAT Math section covers various topics to test your mathematical understanding and problem-solving abilities. Here’s a detailed breakdown of the key types of PSAT math problems, with examples and elaborations for each type:

1. Linear Equation in One Variable

These problems ask you to solve for a single unknown value, typically represented by a letter like xxx. The straightforward equation involves basic operations like addition, subtraction, multiplication, or division.

Example:

Solve 2x−5=9.

How to solve:

Add 5 to both sides:

2x=14

Now divide by 2:

x=7

2.Linear Equation in Two Variables

These involve two unknowns, usually represented as x and y. You might be asked to solve for one variable in terms of the other or understand the relationship between x and y when graphed as a line.

Example:

          Solve for y in 3x+y=12

How to solve:

Add 5 to both sides:

2x=14

Now divide by 2:

x=7

3.System of two Linear Equations in Two Variables

These problems give you two equations with two unknowns. Your task is to find the values of x and y that make both equations true. You can use methods like substitution or elimination.

Example:

Solve the system:

2x+y=10

x−y=3.

How to solve:
First, solve one equation for one variable, like x=y+3, then substitute into the other equation to find both x and y.   

4.Linear Inequalities in One Variables

Similar to equations but with inequality signs (>,<,≥,≤) instead of an equals sign. The solution is a range of values, rather than one specific number.

Example:
Solve 3x+4>10

How to solve:
Subtract 4 from both sides:

3x>6
Now divide by 3:
x>2

This means xxx can be any number greater than 2.

Are You a Tutor or a Test Prep Institute?

Give your students a Duolingo-like platform for the SAT with Shopify-like customization for tutors and test prep institutes.

5.Linear Inequality in Two Variables

These involve two variables, like x and y, and are often represented as shaded regions on a graph, showing where the inequality holds true.

Example:
Graph the inequality 2x+y≤6

How to solve:
First, graph the line 2x+y=6, then shade the region where the inequality is true (below the line for).

6.Linear Functions

These represent relationships between two variables that form a straight line when graphed. You might be asked to find the slope (the steepness of the line) or the intercepts (where the line crosses the axes).

Example:
Find the slope of the line y=5x+3

How to solve:
In this equation, the number in front of x (here, 5) is the slope, which tells you how steep the line is.

7.Ratios,Rates,Proportions

These problems deal with comparing two or more quantities. Ratios show a comparison, rates tell you how one thing changes compared to another, and proportions are equations that show two ratios are equal.

Example:

If 3 apples cost $6, how much do 5 apples cost?

How to solve:
Set up a proportion:

6/3 = 5/x​, where x is the unknown cost.

Solving gives x=10, so 5 apples cost $10

8.Percentage

These problems require you to calculate parts of a whole or figure out percentage increases or decreases.

Example:

What is 15% of 200?

How to solve:

Multiply 200 by 0.15:

200×0.15=30

So, 15% of 200 is 30.

9.Probability

Probability measures how likely an event is to happen, expressed as a number between 0 and 1 (or 0% to 100%).

Example:

If you roll a fair die, what is the probability of getting a 4?

How to solve:

There are 6 sides to the die, and only one side has a 4. So, the probability is ⅙,  or about 16.67%

10.One-Variable Data

In problems with one-variable data, you’re working with a set of numbers that only involve one kind of information (or variable). For example, this could be test scores, ages, heights, or any other single characteristic. The goal is often to summarize the data using measures like the mean, median, or mode.

Example:

Find the median of the data set: 5, 7, 9, 12, 15.

How to solve:

The median is the middle number when the data is ordered:

Median = 9.

11.Two-Variable Data

In two-variable data, you’re looking at how two different variables are related to each other. These relationships are often shown on a scatter plot, where one variable is on the x-axis (like hours studied) and the other is on the y-axis (like test scores). You may need to find patterns, like whether one variable increases as the other increases, or use the line of best fit to predict future outcomes.

Example:

A study tracks the number of hours students spend studying (x) and their corresponding test scores (y). The data for 6 students is as follows:

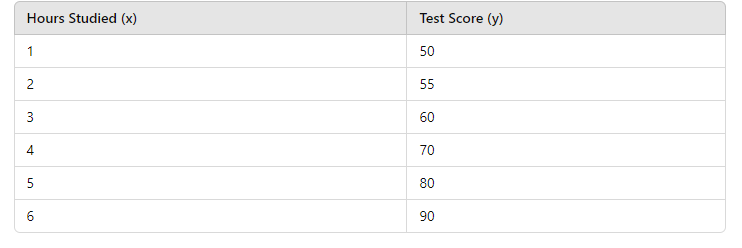
a. Plot the data on a scatter plot with “Hours Studied” on the x-axis and “Test Score” on the y-axis.

b. Determine if there is a positive, negative, or no correlation between hours studied and test scores.

c. Draw a line of best fit on the scatter plot.

d. Use the line of best fit to predict the test score for a student who studies for 7 hours.

How to solve: 

  1. Plot the points (1, 50), (2, 55), (3, 60), (4, 70), (5, 80), and (6, 90) on a scatter plot, with “Hours Studied” on the x-axis and “Test Score” on the y-axis.
  2. There is a positive correlation—as hours studied increase, test scores increase.
  3. A line of best fit can be drawn through the data points, roughly following y=8x+42
  4. Using the line equation y=8x+42, for 7 hours of study:

y=8(7)+42=98

So, the predicted test score for 7 hours of study is 98.

Join the Learning Revolution with LearnQ.ai!

Enhance your Digital SAT study routine with AI-driven insights and personalized practice tests.

12.Inference from Sample Statistic

These problems ask you to make predictions about a whole group based on data from a smaller sample. For example, you might estimate the average height of a population based on a sample group’s heights.

Example: 

A company wants to estimate the average daily screen time of its employees. A random sample of 40 employees reveals an average daily screen time of 6 hours, with a standard deviation of 1.5 hours.

Based on this sample, estimate the average daily screen time of all employees in the company. What range of values would you expect to capture the true average daily screen time with 99% confidence?

How to solve:

To estimate the average daily screen time for all employees, we can calculate a 99% confidence interval for the population mean using the formula:
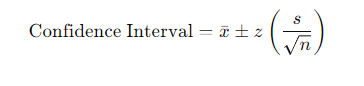
Where:

  • = sample mean = 6 hours
  • s = sample standard deviation = 1.5 hours
  • n = sample size = 40
  • z = z-score for 99% confidence = 2.576 (from the standard normal distribution)

First, calculate the standard error of the mean:

Now, compute the confidence interval:

Margin of Error = z×Standard Error=2.576×0.237≈0.611

The confidence interval is:

Confidence Interval=6±0.611

Confidence Interval = (6−0.611,6+0.611)=(5.389,6.611)

Therefore, With 99% confidence, we estimate that the true average daily screen time for all employees in the company is between 5.39 and 6.61 hours.
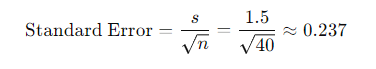
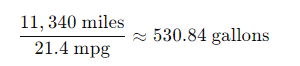
13.Evaluating Statistical Claims

In these problems, you’ll be asked to judge whether a claim made from data is reasonable or supported by the evidence.

Example:

 A school wants to survey 20 students about their favorite school lunch. Which of the following methods will result in a random sample?

How to solve:

Selecting 20 students randomly from a list of all students using a random number generator ensures that each student has an equal chance of being selected.

14.Data Analysis

You’ll work with tables, charts, or graphs to interpret and analyze data. This could include calculating averages, identifying trends, or making predictions.

Example:

In the United States, the maintenance and construction of airports, transit systems, and major roads is largely fund–\ed through a federal excise tax on gasoline. Based on the 2011 statistics given below, how much did the average household pay per year in federal gasoline taxes?

  • The federal gasoline tax rate was 18.4 cents per gallon.

. The average motor vehicle was driven approximately 11,340 miles per year.

The national average fuel economy for noncommercial vehicles was 21.4 miles per gallon.

  • The average American household owned 1.75 vehicles.

How to solve:

Calculate the total gallons of gasoline used per vehicle per year:  


Calculate the total gallons of gasoline used per household:

                       Total gallons per household=Gallons per vehicle×Number of vehicles

  Calculate the total federal gasoline tax paid per household:

                       Total tax=Total gallons per household×Tax rate


Answer: $170.63.

CONNECT WITH TOP SAT ACHIEVERS

Join our Thriving Discord Community

15.Equivalent Expression

Here, you’ll be asked to simplify algebraic expressions or rewrite them in a different form using properties like distribution or combining like terms.

Example: Simplify 2(x+3)−x.

How to solve:

Distribute the 2

2x+6−x.

Now combine like terms:

x+6.

16.Nonlinear Equation

These are equations where the variable is raised to a power other than 1, like quadratic equations. When graphed, these equations produce curves, not straight lines.

Solve the equation s2−4s−5=0 where S = 3/2 p 

How to solve: 

Substitute s = 3/2 p into the quadratic equation s2−4s−5=0.

Simplify the resulting equation by expanding and combining like terms.

Clear fractions by multiplying through by the denominator.

Solve the resulting quadratic equation for ppp using the quadratic formula.

Find the corresponding values of sss using s = 3/2 p

17.Nonlinear Function

These involve powers or other non-linear operations. They are often graphed as curves and have different properties from linear functions, such as varying rates of change.

Function: f(x)=x2+3x+2

Shape: The graph is a parabola that opens upwards.

Vertex: The lowest point of the parabola, found at ( – 3/2, -1/4)

Intercepts: Y-intercept is (0,2); X-intercepts are (−1,0) (−1,0) and (−2,0)

18.Area and Volume

These problems require you to calculate the area of shapes like rectangles and circles, or the volume of 3D objects like cubes and cylinders.

Example: 

Find the surface area and volume of a rectangular prism (box) with the following dimensions:

  • Length = 5 cm
  • Width = 3 cm
  • Height = 4 cm
How to solve:  Surface Area: 2(lw+lh+wh)=2(15+20+12)=94 cm2 Volume: l×w×h=5×3×4=60 cm3 

19.Lines ,Angles and Triangles

These problems test your understanding of geometric relationships between angles, parallel lines, and properties of triangles (like the sum of the angles being 180 degrees).

Example: 

 In triangle ABC, angle A is 30 degreesand angle B is 45 degrees. Find the measure of angle C.

How to solve: 

Use the fact that the sum of angles in a triangle is 180 degrees.

Angle C=180−(30+45)=105

20.Right Triangles and trigometry

Here, you’ll use the Pythagorean theorem or trigonometric ratios like sine, cosine, and tangent to solve problems involving right triangles.

Example: 

 In a right triangle, the length of one leg is 6 cm and the hypotenuse is 10 cm. Find the length of the other leg.

How to solve: 

Use the Pythagorean theorem:

b2=c2−a2

b2=102−62=100−36=64

b=64​=8 cm

21.Circles

These problems involve the properties of circles, including finding the radius, diameter, circumference, or area.

Example : 

A circle has a radius of 7 cm. Find the circumference and area of the circle.

How to solve:  Circumference: 2πr=2π×7=14π≈44 cm Area: πr2=π×72=49π≈154 cm2

By understanding these different types of problems, you’ll be better prepared for the PSAT math section. Practice solving problems in each category, using resources like those from the College Board, Khan Academy, and LearnQ, and you’ll build the confidence and skills you need to succeed!

Curious about the differences between the digital SAT and PSAT? Check out our blog: What Is the Difference Between Digital SAT & PSAT?

Empower Your Students with LearnQ.ai

Book a demo today to see how our platform can elevate your test preparation programs.

Conclusion: 

Achieving proficiency in the PSAT Math section demands a thorough understanding of essential problem types, such as algebra, advanced math, geometry, and data interpretation. Regular practice in these areas is crucial for excelling on the exam. Remember, consistent effort is key to success, and becoming well-acquainted with these problem types will significantly enhance your performance.Ready to boost your PSAT math score? Get started with LearnQ.ai—your ultimate tool for success!

Table Of Content

Free Digital SAT Practice with AI Tools.

Related Blogs

SUBSCRIBE TO
WEEKLY NEWSLETTER

Get the best detailed & latest updates in education technology and also the advancement of AI in education delivered to your inbox. These newsletter focuses on the research & education.

Scroll to Top