If you’re getting ready for the Digital SAT, you’ve likely noticed a big change: instead of using a regular calculator, you’ll have Desmos, a powerful digital math tool built right into the test.
Desmos isn’t just any calculator; it’s a flexible and easy-to-use tool that can handle everything from simple math to complex graphs. For students, this means one less thing to carry.
For teachers, it’s a chance to teach students how to use a tool designed to work seamlessly with the digital test format and support their math skills in a new way.
This blog is your guide to using Desmos effectively for the Digital SAT. We’ll cover its key features, advantages, and tips for problem-solving and troubleshooting.
Introduction to Desmos as a Math Calculator
Desmos is a powerful online calculator that makes math easier to understand. It goes beyond basic calculations, letting you graph functions, solve equations, and visualize data.
If you’re getting ready for the Digital SAT, Desmos is a great tool for learning math concepts and improving your test-taking skills.
Here, you’ll see what Desmos offers, why it’s essential for the Digital SAT, and how it’s better than traditional calculators.
Importance of Desmos in the Digital SAT Exam
Desmos plays a crucial role in the Digital SAT, and here’s why it matters to you:
- Perfect for Digital Testing: Desmos is built for the SAT’s online format, making solving math problems directly within the test environment simple.
- Boosts Problem-Solving Skills: Desmos allows you to explore problems hands-on, which is especially useful for algebra and geometry.
- Equal Access for All: Since Desmos is part of the SAT platform, every test-taker uses the same calculator, making it fair and consistent.
- Saves You Time: Desmos simplifies calculations and graphing, helping you manage time better during the test.
- Support for Teachers: If you’re a teacher, Desmos allows you to provide students with practice on the exact tool they’ll use on test day, making your instruction more impactful.
Advantages of Desmos Over Traditional Calculators
When you compare Desmos to traditional calculators, it offers several distinct benefits that can give you an edge on the SAT:
- Instant Graphing: Desmos instantly lets you create and explore graphs, a significant advantage for tackling SAT algebra and geometry questions.
- Advanced Algebra Tools: With Desmos, you can easily handle complex equations and inequalities, simplifying the solution of challenging problems.
- Easy-to-Use Interface: Desmos is designed to be intuitive, allowing you to navigate quickly, even if you’re new to digital calculators.
- No Extra Cost: Because Desmos is embedded in the Digital SAT, you don’t need to buy or bring a calculator, which saves money and removes extra worry on test day.
- Visual Data Tools: Desmos helps you visualize data, making it easier to understand and solve data and function-based questions.
Now that you know why Desmos is such a helpful tool for the Digital SAT, let’s go over how to get started and use its features to your advantage on test day.
Getting Started with Desmos
Getting comfortable with Desmos is key to using it confidently on the Digital SAT.
Knowing how to access it, move around the interface, and use its main features will help you solve math problems more easily and save time on test day.
Accessing Desmos on the Digital SAT Platform
To start using Desmos on the Digital SAT, follow these steps:
- Log In: When you begin your digital SAT, you’ll be logged into a secure testing platform.
- Locate the Calculator Tool: During the math section of the Digital SAT, you’ll find the Desmos calculator icon in the toolbar on your screen.
- Open the Calculator: Click on the Desmos icon to open the calculator, which will appear on a separate, interactive window.
- Adjust Window Size (If Needed): You can resize or reposition the calculator window on your screen for easier visibility and navigation alongside the test questions.
- Practice Accessing Quickly: Familiarize yourself with efficiently opening and closing the calculator, as time management is crucial during the exam.
Interface and Basic Navigation in Desmos
The Desmos interface is intuitive but packed with features. Here are the main components you’ll use for the SAT:
- Expression Entry Field: Located on the left side, this is where you’ll enter equations, expressions, or functions. It supports multi-step operations so that you can type complex calculations directly.
- Graphing Window: In the main section, you’ll see a real-time graphing window for visualizing equations, plotting points, or analyzing functions.
- Toolbar: Across the bottom, you’ll find essential math tools, including zoom, settings, and basic function controls.
- Keyboard and Functions Panel: Desmos provides an on-screen keyboard with additional function buttons for trigonometry, exponents, and other advanced operations, reducing the need for manual input and making navigation easier.
Understanding the Calculator Layout
To use Desmos effectively, get familiar with these essential tools and layout components:
- Expression List
This area allows you to enter functions and equations directly. You can input expressions like y = 2x + 1 or f(x) = x^2, using the keyboard for precise entry.
After typing an equation, press Enter to add it to the list. This allows you to work with multiple expressions simultaneously.
- Graphing Controls
In the graphing window, you can zoom in and out, adjust the axes, and toggle between standard and scientific modes.
These options are beneficial for analyzing graphs and solving equation-based questions.
- Equation and Function Tools
Desmos supports a variety of inputs, from functions to inequalities, enabling you to compare multiple equations or analyze intersections, slopes, and solutions.
- Result Display
Desmos provides real-time feedback as you input each expression, instantly displaying calculated results or graphs.
- Clear and Reset Functions
Use the clear button to reset the calculator, helping you start fresh for each question without leftover data.
Now that you know how to start with Desmos, let’s look at its core features.
Also read: Desmos Graphing Calculator: Your Ally in the Digital SAT
Core Features of Desmos for Digital SAT
Desmos offers powerful features that make solving SAT math questions easier and faster.
With features for graphing, solving equations, and analyzing data, Desmos helps you tackle challenging problems confidently and accurately on test day.
Graphing Capabilities in SAT Questions
Desmos’s graphing tool is extremely helpful for visualizing and solving SAT math problems. Here’s how to make the most of it:
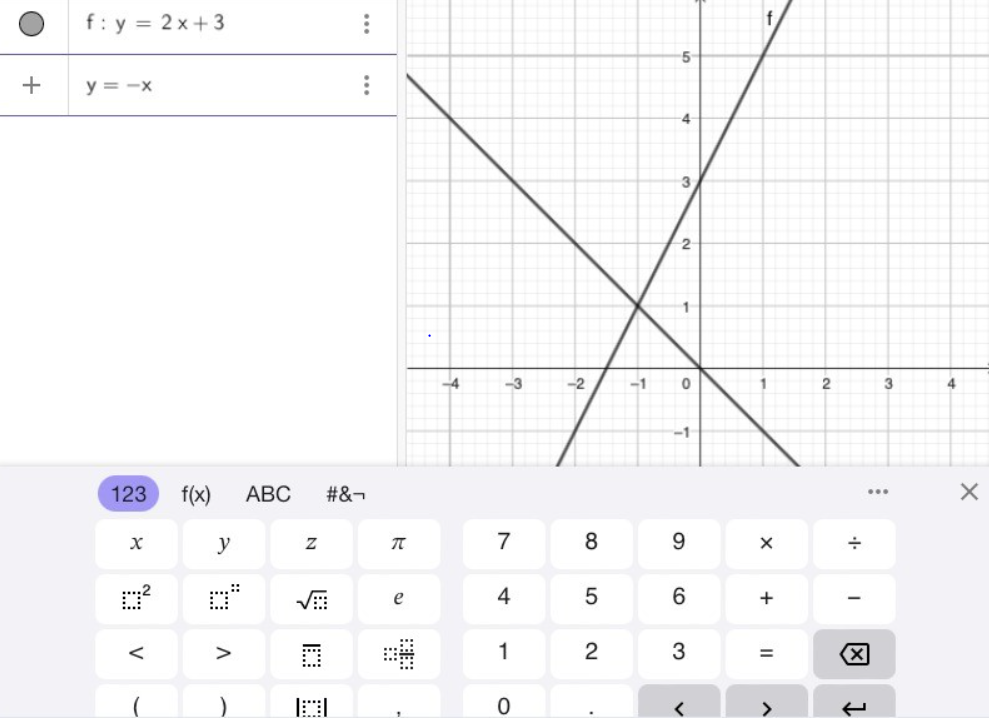
- Plotting Functions: Quickly graph various functions, linear, quadratic, exponential, logarithmic, and trigonometric, by entering equations like y = 2x + 3. This helps you analyze functions and identify slopes and intercepts.
- Finding Intersections: To solve systems of equations, enter multiple equations, and Desmos will show intersection points automatically, making it easy to see solutions.
- Zoom and Axis Adjustments: You can adjust the graph view by zooming in or out to focus on specific parts of a function, which helps you interpret data for more complex questions.
- Table of Values: Generate a table of values for any function to spot patterns or verify answers.
- Geometric Transformations: Use Desmos to explore transformations like translations, reflections, rotations, and dilations, which can help visualize changes in geometric shapes.
Algebraic Functions and Calculation Tools
Desmos also handles complex algebra problems, which are a big part of the SAT. Here’s how it supports you:
- Solving Equations and Inequalities: Desmos provides instant solutions graphically or highlights solution areas, whether you’re working with single equations or inequalities.
- Function Evaluation: Plugin specific values to evaluate functions directly, saving time on multi-step calculations.
- Factorization and Expansion: Desmos can factor and expand expressions automatically, which helps simplify polynomials.
- Exponents and Logarithms: You can easily perform exponential and logarithmic calculations, which are essential for growth or decay problems.
- Trigonometric Functions: Access sine, cosine, tangent, and other trigonometric functions to solve geometry questions involving angles and periodic functions.
Statistical Analysis Tools
Desmos offers powerful features for data handling and statistics, simplifying calculations for SAT questions on probability and data analysis:
- Data Visualization: Enter data sets to create scatter plots, histograms, or box plots. These visualizations help you spot trends, patterns, and outliers.
- Regression Analysis: Use regression tools to find lines of best fit and calculate correlation coefficients, which are useful for understanding relationships in data sets.
- Basic Statistical Calculations: Quickly calculate mean, median, mode, standard deviation, and quartiles for data analysis questions.
- Probability Distributions: Although Desmos doesn’t calculate probabilities directly, it supports exploring distributions like normal and binomial, aiding in probability-related questions.
Now that you know the key features of Desmos, let’s look at the usage of Desmos for problem-solving to see how this can help you tackle real SAT questions smoothly.
Using Desmos for Problem Solving
Desmos can make solving math problems on the Digital SAT much easier. It provides algebra, geometry, and complex calculation tools and helps you work through questions step-by-step.
Here’s how to use Desmos to solve different SAT problems efficiently.
Step-by-Step Guide to Solving Algebraic Equations
Desmos is a great tool for solving algebra problems quickly and accurately on the SAT. Here’s a simple guide to using it:
- Enter the Equation
Type in your equation, like 2x + 3 = 11, directly into Desmos. Use the Expression List to keep everything organized if the problem has multiple parts.
- Solve for Variables
Desmos will display the solution when possible once you enter the equation.
For quadratic or more complex equations, you can graph them to find x-intercepts, which represent the solutions.
- Verify Solutions
For questions requiring double-checking your answer, graph the equation and ensure the intercepts or solution points match the answer choices.
Applying Desmos in Geometry and Trigonometry Questions
Desmos is also helpful for geometry and trigonometry questions on the SAT. Here’s how it can assist you:
- Graphing Shapes: Plot shapes like circles using equations (for example, (x – h)^2 + (y – k)^2 = r^2 for circles). This helps you see geometric relationships and understand spatial properties.
- Using Slopes and Angles: For questions about slopes or angles, graph lines in Desmos and use the tools to measure slopes. This can also help you verify if lines are perpendicular or parallel.
- Trigonometric Functions: Type in trigonometric functions like sin(x), cos(x), or tan(x) to see their graphs. This is useful for understanding periodic functions, finding peaks, and solving trigonometry problems that appear on the SAT.
Techniques for Using Desmos in Complex Calculations
Desmos offers advanced features that make it easier to handle complex SAT questions. Here’s how to use them effectively:
- Function Notation: Define functions like f(x) = 2x + 5 and evaluate them quickly by plugging in values like f(3). This saves time on questions requiring multiple evaluations.
- Systems of Equations: Enter multiple equations to see them graphed together. Desmos shows intersection points automatically, helping you solve systems visually.
- Tables: Use tables to organize data and generate points on the graph. This is especially helpful for spotting trends or patterns in data questions.
- Customizing Graphs: Zoom in on specific areas and use different colors or line styles to distinguish functions, making it easier to track multiple equations.
- Implicit Equations: Graph implicit equations like ellipses or hyperbolas to analyze their properties or intersections with other curves, which can be helpful for advanced questions.
- Regression Analysis: Fit data to linear or quadratic regression models to find the best-fit line or curve. Use the regression equation to make predictions, which is often needed in data analysis questions.
Now that you know how to use Desmos to solve different types of SAT problems, let’s look at some tips and best practices to help you use it smoothly and efficiently on test day.
Tips and Best Practices for Using Desmos in SAT
To make the most of Desmos on the SAT, here are some simple tips to help you use it quickly and accurately on test day.
Maximizing Efficiency with Desmos in Limited-Time Scenarios
Time is crucial on the SAT, so using Desmos efficiently can give you an edge. Here are a few quick strategies:
- Practice Speedy Input: Familiarize yourself with quickly entering equations, plotting points, and using functions. The more comfortable you are, the less time you’ll spend navigating the tool during the test.
- Use the Expression List Wisely: Keep equations organized in the Expression List. This makes it easy to toggle between calculations and saves time when adjusting inputs.
- Know When to Graph: Not every question requires a graph. Use graphing for visual checks only when it helps answer the question faster.
Common Pitfalls and How to Avoid Them
Desmos is powerful, but there are some common mistakes students make. Here’s how to avoid them:
- Misinterpreting Graphs: Remember that Desmos shows an approximate graph. Don’t rely on it for precise values unless the SAT question asks for a general answer.
- Entering Equations Incorrectly: Double-check your entries, especially for signs and parentheses. A slight mistake can lead to incorrect solutions and wasted time.
- Relying Solely on the Graph: Desmos is helpful, but always verify that the answer matches the question’s requirements. Don’t rush to conclusions based solely on visual information.
Practicing Desmos Usage Before the Exam
Practicing with Desmos before the SAT is a great way to boost your test performance. LearnQ, a smart learning platform, lets you do that by including a built-in graphing calculator in its Digital SAT mock tests and a free diagnostic test.
This setup gives you actual SAT practice with Desmos, helping you get comfortable with how it works before test day.
Here are the Key Benefits of LearnQ’s Calculator:
- Immediate Access: The calculator is in the math section, so you don’t have to switch between tools.
- Advanced Functionality: With graphing, equation solving, and data analysis, this calculator has everything you need, just like a traditional graphing calculator.
- Time-Saving Efficiency: By practicing in a streamlined setup, you can save time and focus entirely on problem-solving, which is essential for pacing during the real exam.
With these tips in mind, let’s cover some common issues you might face with Desmos and how to handle them on test day.
Also read: How to get started with LearnQ.ai for FREE?
Troubleshooting Common Issues with Desmos
Using Desmos on the SAT is usually straightforward, but sometimes issues can pop up.
Knowing how to handle technical glitches, fix input errors, and clear up common misunderstandings can help you stay calm and focused. Here’s how to tackle any challenges with Desmos on test day.
Handling Technical Glitches During the Exam
If Desmos or the testing platform experiences technical issues, stay calm and follow these steps:
- Report the Issue Immediately: Alert a proctor or testing supervisor when you notice a problem.
- Refresh or Reset: If the calculator freezes, refresh or reopen it within the platform.
- Use Backup Options: Familiarize yourself with basic calculations so you can solve simpler problems manually if needed. Desmos issues are rare, but having a backup approach for time-sensitive questions is helpful.
Understanding and Resolving Input Errors
Input errors are common but easily fixable if you know what to look for:
- Check Parentheses and Signs: Misplaced parentheses or missing negative signs are common errors. Double-check these to ensure accuracy.
- Verify Function Names: Ensure correct spelling of functions like sin, cos, or log, as typos can lead to incorrect calculations.
- Use the Expression List: Review your expressions in the Expression List to spot errors quickly. This feature helps keep all entries organized, making it easier to identify issues.
Conclusion
The Digital SAT can feel challenging, but Desmos is a powerful tool for solving math problems faster and easier.
With its graphing tools, algebra functions, and clear layout, Desmos helps you handle even the most challenging questions.
It’s important to practice ahead of time to get the best results. The more familiar you are with Desmos’s features, the more confident you’ll feel using it on test day.
Remember to stay calm, double-check your entries, and use Desmos only where it helps your answer.
A resource like LearnQ can support your prep even more. With personalized analytics, AI-driven practice tests, a free study plan, DSAT Math tutor Mia, and gamified SAT prep, LearnQ helps you build skills with Desmos and feel ready and confident for exam day.
Get started for free with LearnQ today to make the most of Desmos and prepare for success on the SAT!
The LearnQ Editorial Team is made up of certified Digital SAT tutors, college admissions specialists, and AI education researchers. Our tutors have personally helped over 10,000 US high school students improve their SAT scores, with an average improvement of 150+ points. We combine hands-on tutoring expertise with AI-powered insights from the LearnQ platform, which has analyzed millions of Digital SAT practice questions. Every article we publish is reviewed against the latest College Board Bluebook guidelines and cross-checked with real student performance data. Our mission is simple: give every student the same quality of prep that was once only available at expensive tutoring centers.