Wondering how many students get 1500 on SAT? Getting a 1500 on the SAT places you in an elite group of test-takers, often seen as a significant milestone for students aiming for top-tier universities.
Whether you’re a student striving for excellence, a parent guiding your child, or a teacher supporting academic growth, understanding the significance of this score can be crucial in shaping study strategies and goals. In fact, only 7% of test-takers score between 1400 and 1600, which includes the coveted 1500 mark.
Out of over 1.9 million SAT test-takers, only a relatively small percentage manage to reach this achievement. So, just how many students score 1500 on the SAT, and what does it take to get there? Dive in to explore that further.
Understanding SAT Score Distribution
Understanding the SAT score distribution is essential whether you’re a student aiming for top scores, a teacher helping students set realistic goals, or a parent guiding your child through the test preparation process.
Knowing where a score stands in comparison to others offers clarity on just how competitive that number is.
This section covers recent national average SAT scores and explains where a 1500 fits in the distribution. This will give you a clear sense of what it takes to reach this benchmark.
National Average SAT Scores
When discussing SAT scores, one question that often comes up is how many students get 1500 on SAT. While reaching that score is impressive and places students in the top percentile, it’s essential to understand how the majority of test-takers perform.
The following table breaks down the total SAT scores along with their corresponding nationally representative percentiles and user group percentiles. This offers a clearer perspective on where a 1500 score stands compared to others.
| Total Score | Nationally Representative Percentiles | User Group Percentiles |
| 1600-1560 | 99+ | 99+ |
| 1550-1500 | 99 | 99-98 |
| 1490-1450 | 99-96 | 97-96 |
| 1440-1400 | 98-97 | 95-93 |
| 1390-1350 | 97-94 | 92-90 |
| 1340-1300 | 94-91 | 89-86 |
| 1290-1250 | 90-86 | 85-82 |
| 1240-1200 | 85-81 | 81-76 |
| 1190-1150 | 80-74 | 75-70 |
| 1140-1100 | 73-67 | 69-63 |
| 1090-1050 | 66-57 | 62-55 |
| 1040-1000 | 56-48 | 54-47 |
| 990-950 | 46-38 | 45-40 |
| 940-900 | 37-29 | 39-32 |
| 890-850 | 27-21 | 31-24 |
| 840-800 | 20-14 | 23-16 |
| 790-750 | 13-8 | 15-9 |
| 740-700 | 7-4 | 8-5 |
| 690-650 | 3 | 4-3 |
| 640-600 | 1 | 2-1 |
| 590-550 | 1- | 1 |
| 540-500 | 1- | 1 |
| 490-450 | 1- | 1 |
| 440-400 | 1- | 1 |
Also Read: Digital SAT Vocabulary Words You Must Know.
After reviewing the overall SAT score distribution, it’s also helpful to break down the individual section scores. Below is a table showing percentiles for each section, comparing both national and user group percentiles.
| Section Score | Reading and Writing (National Percentiles) | Reading and Writing (User Group Percentiles) | Math (National Percentiles) | Math (User Group Percentiles) |
| 800-750 | 99+ | 99+ | 99+ | 99+ |
| 740-700 | 99-97 | 97-93 | 98-95 | 95-92 |
| 690-650 | 96-90 | 92-85 | 94-90 | 91-85 |
| 640-600 | 88-79 | 83-74 | 89-81 | 84-77 |
| 590-550 | 76-65 | 72-60 | 79-68 | 75-62 |
Also Read: Comparing Difficulty: Real SAT vs Practice Tests.
SAT Performance by Demographics
Now that you’ve seen how SAT scores are distributed across percentiles, it’s also helpful to understand how scores vary across different demographics.
The following table highlights SAT performance by sex and race/ethnicity. It shows a breakdown of the total SAT score along with separate scores for Evidence-Based Reading and Writing (ERW) and Math.
| Sex and Race/Ethnicity | Total SAT Score | Evidence-Based Reading and Writing (ERW) | Math |
| All students | 1028 | 520 | 508 |
| Male | 1032 | 517 | 515 |
| Female | 1023 | 523 | 500 |
| American Indian/Alaska Native | 901 | 458 | 443 |
| Asian | 1219 | 593 | 626 |
| Black | 908 | 466 | 441 |
| Hispanic | 943 | 482 | 461 |
| Pacific Islander | 925 | 473 | 452 |
| White | 1082 | 550 | 532 |
| Two or more races | 1091 | 556 | 535 |
The 1500 Score Benchmark
A 1500 SAT score is a strong indicator of academic excellence, placing students in the top 1-2% of all test-takers. This score is highly valued in college admissions statistics, where it opens doors to many prestigious universities.
Achieving a score in the 1400-1500 range makes you a competitive applicant for numerous top-tier institutions across the United States.
Here’s a list of colleges and universities in the US that typically accept students with SAT scores between 1400 and 1500:
- Barnard College – New York
- Claremont McKenna College – Claremont, California
- Cornell University – Ithaca, New York
- Dartmouth College – Hanover, New Hampshire
- Emory University – Atlanta, Georgia
- Georgetown University – Washington, District of Columbia
- Hamilton College – Clinton, New York
- Haverford College – Haverford, Pennsylvania
- Middlebury College – Middlebury, Vermont
- Tufts University – Medford, Massachusetts
- University of Pennsylvania – Pennsylvania
- University of Notre Dame – Notre Dame, Indiana
- University of Southern California – Los Angeles, California
- Washington and Lee University – Lexington, Virginia
- Wellesley College – Wellesley, Massachusetts
Also Read: Celebrities and Students with Perfect SAT Scores.
How Many Students Achieve a 1500 Score?
How common is a 1500 score? To understand the scope, it’s important to look at the data and trends surrounding SAT performance. Various factors, such as demographics and school resources, can influence who reaches this level of achievement.
Let’s dive into the numbers and explore the key factors that impact SAT scores.
Statistical Data
When looking at how many students achieve a score of 1500 or higher, it’s clear that such scores are rare, placing those students in a small, competitive group.
Over recent years, the distribution of SAT scores has shown consistent trends, with most students scoring below 1200, while a smaller percentage reaches the top tiers.
The table below shows the breakdown of SAT score ranges and the number of students who fall into each category.
| Total Score Range | Number of Students | Percentage (%) |
| 1400-1600 | 127,589 | 7% |
| 1200-1390 | 324,391 | 17% |
| 1000-1190 | 552,167 | 29% |
| 800-990 | 596,783 | 31% |
| 600-790 | 303,276 | 16% |
| 400-590 | 9,536 | <1% |
Demographic Factors
Demographic elements such as location, family income, and education levels play a significant role in shaping SAT performance. Variations in student scores reflect disparities linked to socio-economic factors, school settings, and regional differences.
The following table illustrates how school location affects test outcomes. This provides insights into the percentage of students meeting benchmarks in Evidence-Based Reading and Writing (ERW) and Math across various regions.
Test Takers by School Location and Mean Total Score
| School Location | Test Takers | Mean Total Score |
| City | 554,482 | 991 |
| Suburb | 765,085 | 1035 |
| Town/Rural | 383,715 | 996 |
| Unknown | 210,460 | 1157 |
Mean Evidence-Based Reading and Writing (ERW) and Math Scores by School Location
| School Location | Mean ERW Score | Mean Math Score |
| City | 504 | 487 |
| Suburb | 526 | 509 |
| Town/Rural | 508 | 488 |
| Unknown | 564 | 593 |
Benchmark Achievement by School Location
| School Location | Met Both Benchmarks (%) | No Benchmarks Met (%) |
| City | 33% | 44% |
| Suburb | 41% | 33% |
| Town/Rural | 33% | 38% |
| Unknown | 69% | 16% |
Factors Influencing SAT Performance
When aiming for top-tier SAT scores, like the 1,505 average seen among Harvard’s applicants, preparation becomes more than just a requirement — it’s the key to success. This stat reflects a trend among competitive students who have mastered the art of consistent study habits and focused practice. Understanding SAT performance trends helps shed light on how the right strategies can significantly influence your score.
Preparation and Study Habits
Success on the SAT doesn’t just happen overnight — it’s the result of focused preparation and smart study habits. Students who consistently practice and refine their approach tend to see the most significant score improvements.
Let’s break down the key factors that can help boost your SAT performance to the next level.
- Effective Study Strategies
Developing a structured study plan is crucial. Breaking down content into manageable sections and creating a study schedule can prevent last-minute cramming and help with better retention. Focus on weak areas and review practice tests to fine-tune your approach.
- The Impact of Consistent Practice
Regular practice not only familiarizes you with the test format but also helps you manage time more effectively during the actual exam. Practice tests simulate the experience and can highlight areas where you need improvement, leading to steady score increases over time.
- Quality Study Resources
Using high-quality materials, such as official SAT practice tests, books, and online resources, ensures you’re preparing with the most accurate content. Seek out reputable prep guides that cover both sections of the test comprehensively.
- Focused Preparation for Weak Areas
Identifying specific sections or question types that challenge you and devoting extra time to mastering them can lead to significant improvements. Whether it’s math, reading, or writing, honing in on these gaps is vital.
- Test-taking Strategies
Learning techniques like the process of elimination, pacing, and handling difficult questions can make a big difference. Efficient test-taking strategies help maximize your score, especially under time constraints.
- Mental and Physical Preparation
Don’t overlook the importance of mental clarity and physical well-being. Proper rest, a balanced diet, and relaxation techniques can contribute to peak performance on test day.
Also Read: Strategic Steps, Tips, & Templates For Effective Lesson Planning.
Preparing for a 1500 SAT Score with LearnQ.ai
When preparing for the SAT, having the right strategies and resources can make all the difference. LearnQ.ai offers an AI-driven platform that provides effective test-taking techniques and personalized tools for students.
Whether it’s maximizing your score through smart techniques or utilizing AI-powered insights, LearnQ is designed to elevate your SAT prep experience.
Let’s break down how LearnQ.ai can help you achieve your target score, with detailed features that make it stand out.
- Personalized SAT Study Plan
Get a free, personalized study plan tailored to your strengths and weaknesses. This AI-driven plan helps you focus on areas that need improvement and sets you on the path to achieving a 1500+ SAT score.

- SAT Score Calculator
The AI-driven SAT score calculator is designed to gauge your understanding through real-time testing, giving you accurate feedback on where you stand and helping you refine your preparation strategy.
- Digital SAT Diagnostic Test
Start with a shorter yet more insightful diagnostic test, which helps pinpoint your current level of preparedness and sets the groundwork for focused Digital SAT prep.

- DSAT Sectional Tests
Engage in topic-wise, mobile-friendly tests that use game-based learning to make preparation enjoyable. These tests are AI-driven and ensure you grasp concepts in a more interactive way.
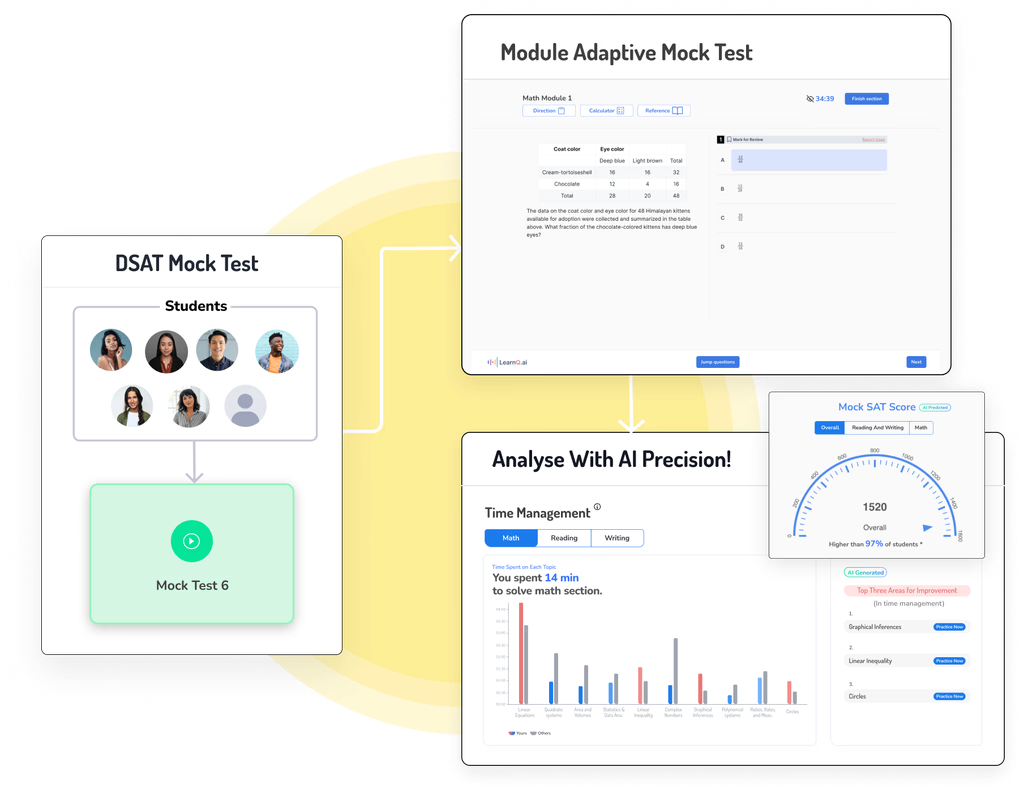
- Realistic Full-Length Practice Tests
LearnQ.ai offers full-length practice tests that mirror the College Board’s Digital SAT format, ensuring you’re fully prepared for the actual exam. The practice tests are designed to replicate the real testing experience, boosting your confidence.
- Mia – AI Tutor for DSAT
Mia, your personal AI tutor, guides you through Digital SAT prep by offering tailored support and feedback. With Mia’s help, your prep is customized to your unique learning needs, ensuring you master even the toughest concepts.

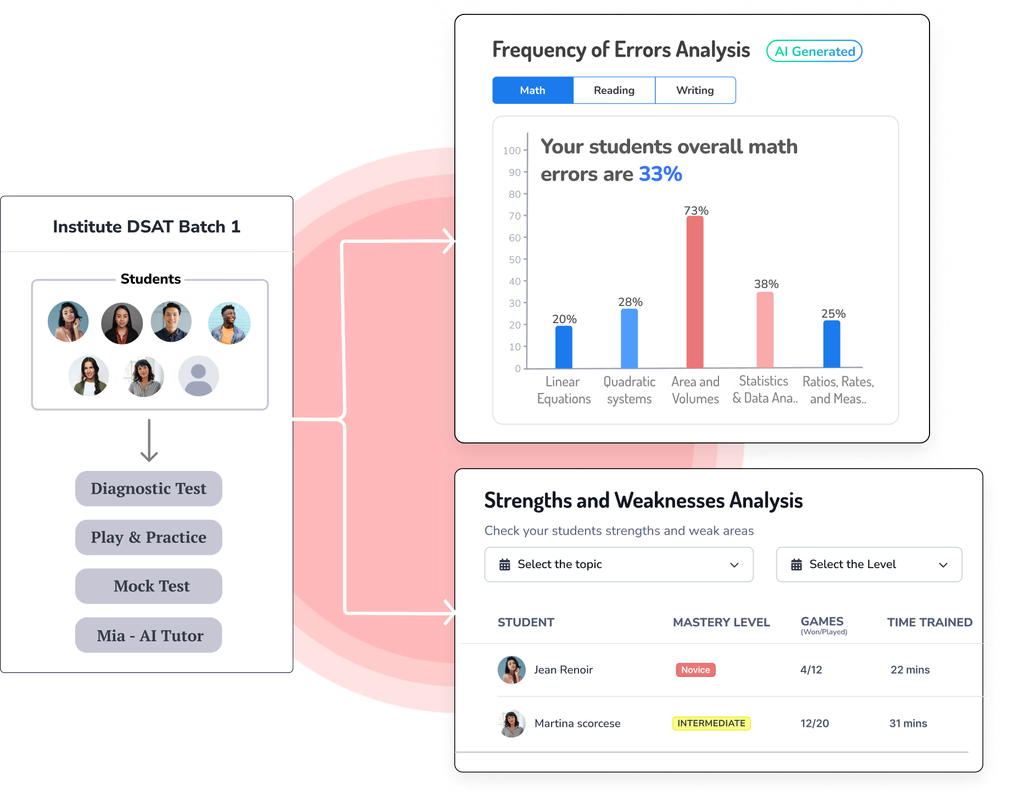
- AI-Driven Analytics and Insights
Track your progress with AI-powered analytics that offer actionable insights into accuracy, time management, and mastery of subjects. This helps you adjust your strategy to optimize your performance.
The Role of Practice Tests
Preparing for the SAT can be challenging, but one of the most effective ways to boost scores is through consistent practice. For students, practice tests not only build confidence but also provide crucial insights into performance.
Teachers and parents play a key role in supporting this process by ensuring students have access to the right tools. With LearnQ.ai, the practice goes beyond repetition, offering AI-driven insights that tailor the learning experience to each student’s needs.
Here’s how practice tests can make a real difference:
- Practice tests help students get familiar with SAT format, question types, and timing.
- Regular practice tests lead to significant score improvements in time management and accuracy.
- LearnQ.ai offers full-length practice tests that closely resemble the actual Digital SAT.
- AI-driven feedback after each test identifies strengths and areas for improvement.
- Consistent use of LearnQ.ai’s tests and feedback helps students work towards their target SAT scores effectively.
Conclusion
Achieving a 1500 SAT score puts students in an elite group, significantly increasing their chances of gaining admission to top universities.
For those wondering how many students get 1500 on SAT, it’s a small percentage, making it a valuable goal worth pursuing. The key to reaching this benchmark lies in focused preparation and smart use of resources.
Students aiming for this score should prioritize consistent practice and use tools like LearnQ.ai, which provides personalized study plans and real-time feedback tailored to individual needs. Start your journey today with LearnQ.ai’s AI-driven platform and give yourself the best chance of hitting that 1500+ score!
The LearnQ Editorial Team is made up of certified Digital SAT tutors, college admissions specialists, and AI education researchers. Our tutors have personally helped over 10,000 US high school students improve their SAT scores, with an average improvement of 150+ points. We combine hands-on tutoring expertise with AI-powered insights from the LearnQ platform, which has analyzed millions of Digital SAT practice questions. Every article we publish is reviewed against the latest College Board Bluebook guidelines and cross-checked with real student performance data. Our mission is simple: give every student the same quality of prep that was once only available at expensive tutoring centers.