The SAT Math section plays a crucial role in showcasing your problem-solving abilities. Whether math is your strength or an area where you need improvement, understanding the critical concepts tested can significantly affect your score.
With over 1.9 million students taking the test, mastering these 25 topics tested on the SAT is essential for standing out.
The section is divided into calculator and non-calculator parts, testing your ability to solve problems accurately and quickly. You’ll encounter questions across domains like Algebra, Advanced Math, and Problem-Solving and Data Analysis, each designed to test different math skills.
With 58 questions spread across these content areas, knowing which concepts to prioritize will help you study smarter. This guide covers the 25 topics tested in the SAT Math section, breaking down what to expect and how to approach each concept.
Get ready to dive into the core areas that can help you achieve your best score.
Get a 1500+ SAT Score With Expert Coaches + AI.
Live 1-on-1 and small group coaching from mentors who've scored 1580+, combined with LearnQ.ai's adaptive AI practice platform. The only SAT prep that works both ways.
The SAT Math section plays a crucial role in showcasing your problem-solving abilities. Whether math is your strength or an area where you need improvement, understanding the critical concepts tested can significantly affect your score.
With over 1.9 million students taking the test, mastering these 25 topics tested on the SAT is essential for standing out.
The section is divided into calculator and non-calculator parts, testing your ability to solve problems accurately and quickly. You’ll encounter questions across domains like Algebra, Advanced Math, and Problem-Solving and Data Analysis, each designed to test different math skills.
With 58 questions spread across these content areas, knowing which concepts to prioritize will help you study smarter. This guide covers the 25 topics tested in the SAT Math section, breaking down what to expect and how to approach each concept.
Get ready to dive into the core areas that can help you achieve your best score.
Linear Equations and Functions (5 Concepts)
1. Linear Equations in One Variable
These involve solving for a single unknown, typically written as ax + b = c, where you isolate the variable x to find its value.
Formula: ax + b = c
- x is the variable (the unknown value to solve for).
- a, b, and c are constants (fixed values in the equation).
Example: Solve for x in the equation
2x + 3 = 7
2x=7−3
2x=4
x=2
2. Linear Equations in Two Variables
These equations involve two variables, typically written in ax + by = c. You’ll often be asked to interpret or graph the equation.
Formula: ax + by = c
- x and y are variables.
- a, b, and c are constants.
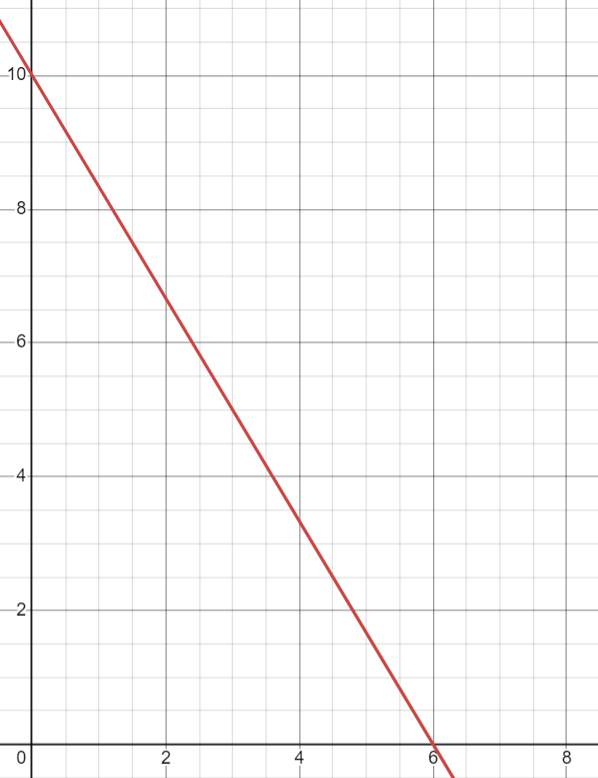
Example: Graph the equation 5x + 3y = 30.
Solution:
This equation has two variables, x and y. To graph it, we can find the intercepts by setting one variable to zero at a time.
When y = 0, the equation becomes:
5x = 3(0) = 30
5x = 30
x = 6
When x = 0, the equation becomes:
5(0) + 3y = 30
3y = 30
y = 10
Graphical Representation:
Get a 1500+ SAT Score With Expert Coaches + AI.
Live 1-on-1 and small group coaching from mentors who've scored 1580+, combined with LearnQ.ai's adaptive AI practice platform. The only SAT prep that works both ways.
3. Linear Functions
A linear function represents a constant rate of change between two variables. Similar to linear equations, these functions are expressed in the form f(x) = mx + b, but they describe relationships rather than specific values.
Formula: f(x) = mx + b or y = mx + b
- x is the independent variable.
- f(x) (or y) is the dependent variable.
- m is the slope (rate of change).
- b is the y-intercept (the point where the line crosses the y-axis).
Example: Given f(x) = 3x + 4, find f(2).
f(2) = 3(2) + 4
f(2 )= 6 + 4
f(2) = 10
4. Systems of Two Linear Equations in Two Variables
These involve solving for two variables using two different equations. Methods like substitution and elimination are standard for finding solutions.
System of Equations Example:
2x + y = 5
3x − y = 4
Solution: Add the equations to eliminate y:
(2x + y) + (3x − y) = 5 + 4
5x = 9
x = 9/5
Substitute x back to find y.
Now that we know that x = 9/5, let’s find y by substituting x back into one of the original equations. Let’s use the first equation:
2x + y = 5
2 (9/5) + y = 5
18/5 + y = 5
Now, subtract 18/5 from both sides:
y = 5 – 18/5
y = 25/5 -18/5
y = 7/5
Conclusion: The solution to the system of equations is x=9/5 and y=7/5.
The Platform Behind LearnQ.ai Is Now Open to You - Start Free
VEGA AI helps institutes create personalized, automated, and scalable test-prep experiences - no coding, no setup hassle.
5. Linear Inequalities in One or Two Variables
These are similar to linear equations but use inequality symbols (>, <, ≤, ≥) instead of an equal sign. You’ll need to solve and graph the solution set.
Example of Inequality: Solve 2x + 3 > 7.
2x > 4 ⇒ x > 2
Graphing: Represent the solution on a number line or in a coordinate plane.
Nonlinear Equations and Functions (4 Concepts)
1. Equivalent Expressions
In this concept, you’ll be asked to simplify expressions or rewrite them in different forms. These questions test your ability to factor, expand, or combine terms.
Example: Simplify the expression:
3(x + 4) − 2(x − 1)
Solution:
First, distribute the constants outside the parentheses to expand the expression:
3(x + 4) = 3x + 12
−2(x − 1) = −2x + 2
Now combine the terms:
3x + 12 − 2x + 2
Combine the like terms 3x and −2x, and then the constants 12 and 2:
(3x − 2x) + (12 + 2) = x + 14
Thus, the simplified equivalent expression is:
x + 14
This is the simplified form of the original expression, showing how terms can be combined to find an equivalent expression.
2. Nonlinear Equations in One Variable
Unlike linear equations, nonlinear equations involve variables raised to powers greater than 1. You might see quadratic or cubic equations in this section.
Formula: ax² + bx + c = 0
- x is the variable.
- b and c are constants.
Example: Solve x² – 4x + 4 = 0
Solution: This is a quadratic equation that can be factored as:
x² – 2x – 2x + 4 = 0
x(x – 2) – 2(x – 2) = 0
(x – 2) (x -2) = 0
x = 2
Nonlinear equations can have one or more solutions, and recognizing when to factor or use other methods will help you solve them efficiently.
3. Nonlinear Equations in Two Variables
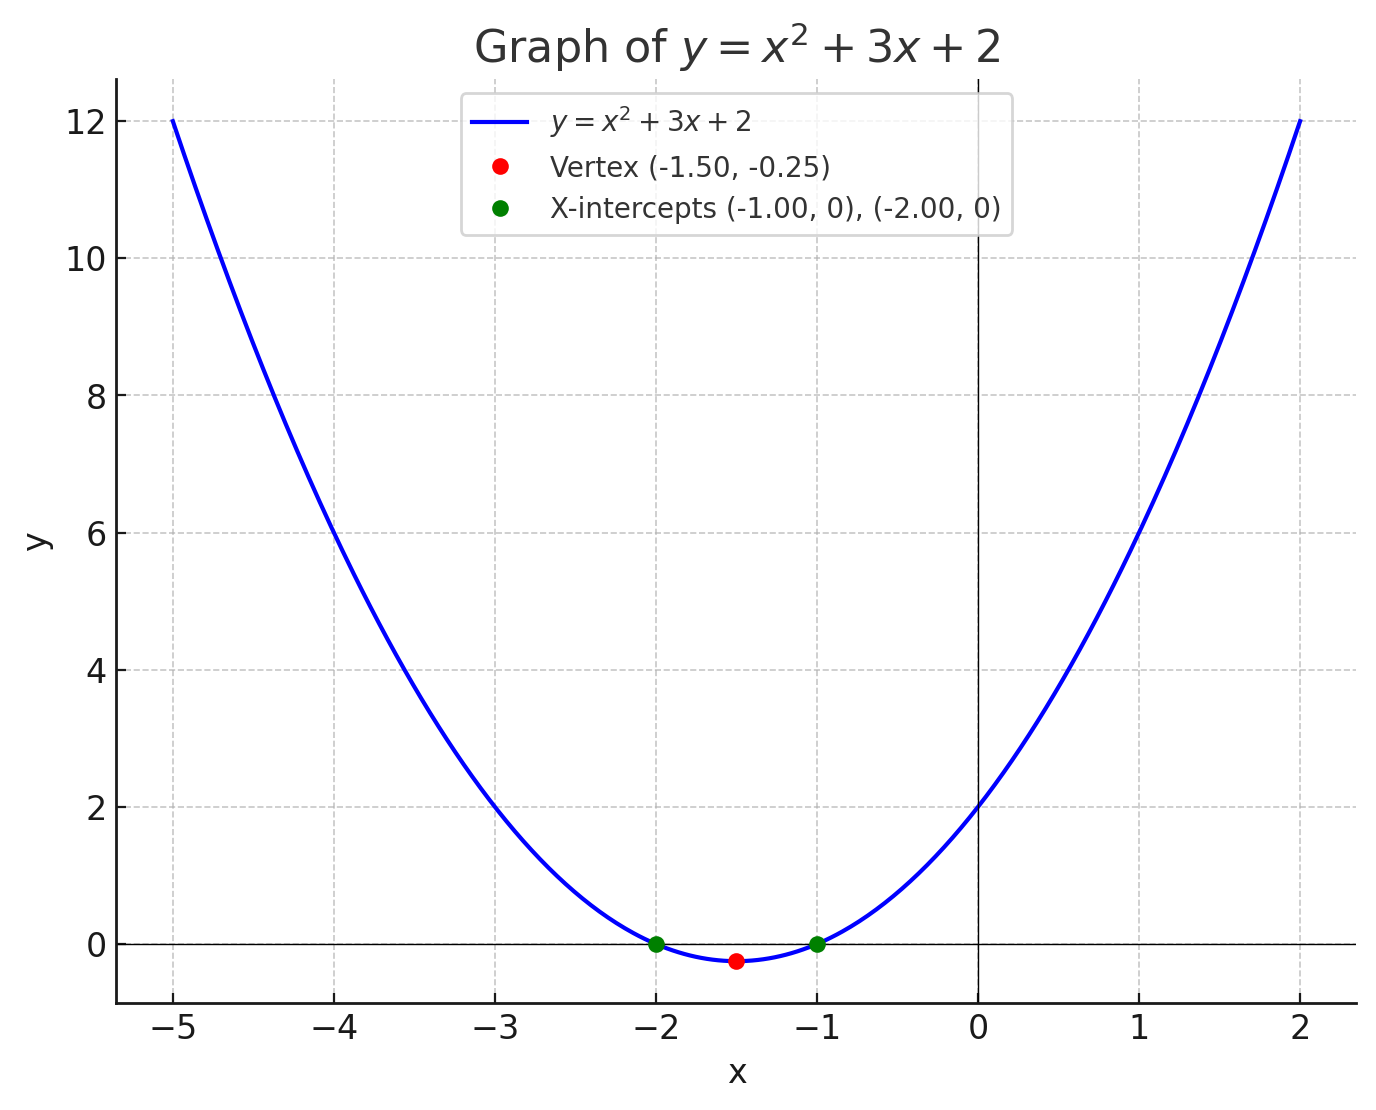
These questions often involve equations with two variables that aren’t linear. You might see parabolas or circles represented by equations like y = ax² + bx + c.
Formula: y = ax² + bx + c.
- x and y are variable.
- a, b, and c are constants.
Example: Graph y = x² + 3x + 2.
You’ll need to find critical points like the vertex and x-intercepts to graph the equation accurately.
4. Nonlinear Functions
Nonlinear functions involve relationships where the rate of change isn’t constant. These functions can be represented in different forms, but you’ll need to understand how to work with them graphically and algebraically.
Example: Find the value of f(x) when f(x) = x² – 2x + 1 and x = 3.
Solution:
f(3) = (3)² – 2(3) +1
9 – 6 + 1
4
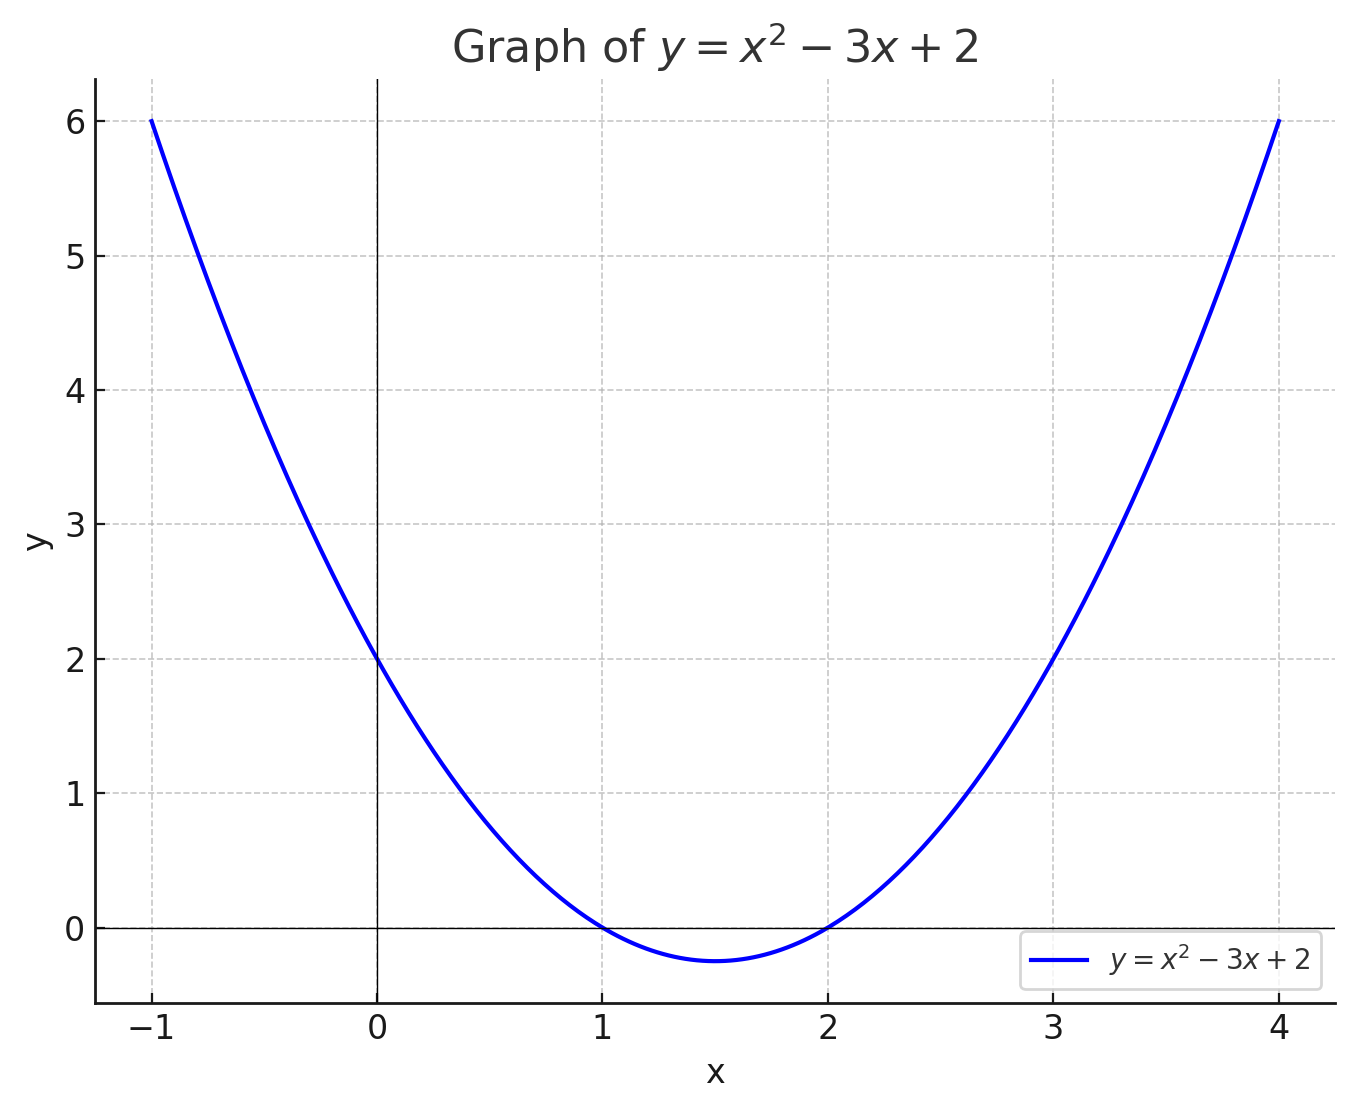
Graphing a Quadratic Equation
Let’s visualize the graph for y = x² – 3x + 2 to understand how nonlinear functions look.
Problem-Solving and Data Analysis (15% of Questions)
Problem Solving and Data Analysis, representing 15% of the questions, is another essential part of the 25 topics tested on the SAT. Expect questions that involve ratios, percentages, and interpreting statistical data from charts and tables. Mastering these concepts will help you approach these questions with confidence.
Rates, Ratios, and Proportional Relationships (3 Concepts)
1. Ratios and Rates
Ratios compare two quantities, while rates show how one quantity changes in relation to another. These are common in word problems, where you may need to find a missing value.
Example: If the ratio of boys to girls in a class is 4:3, and there are 28 students in total, how many boys are there?
Solution: Let the number of boys be 4x, and the number of girls be 3x. Since there are 28 students:
4x + 3x = 28
7x = 28
x = 4
Thus, there are 4 × 4 = 16 boys in the class.
2. Proportional Relationships
In proportional relationships, quantities increase or decrease at the same rate. Solving this often involves setting up a proportion.
Example: If 5 pounds of apples cost $10, how much will 8 pounds cost?
Solution: Set up a proportion:
5/10 = 8/x
5/x = 80
x = 16
So, 8 pounds of apples will cost $16.
3. Units of Measure
You’ll need to convert between units, like time, distance, or weight, using conversion factors.
Example: Convert 30 miles per hour to feet per second.
Solution: Use conversion factors: 1 mile = 5280 feet, and 1 hour = 3600 seconds:
30miles/1 hour x 5280 feet/1 mile x 1 hour/ 3600 seconds = 44 feet/ 1 second
Thus, 30 miles per hour equals 44 feet per second.
To take your SAT preparation to the next level, LearnQ.ai offers a suite of tools designed to help you excel. With customizable practice tests and Mia, an AI tutor, you’ll have the support you need to master even the most challenging math concepts.
By combining the College Board’s free resources with LearnQ’s advanced preparation platform, you can improve your scores, minimize the need for retakes, and avoid extra score-sending fees.
Also Read: Comparing Difficulty: Real SAT vs Practice Tests.
Statistical Analysis (7 Concepts)
1. Percentages
These questions test your understanding of how to find percentages, percentage increases or decreases, and parts of a whole.
Example: What is 15% of 200?
Solution:
15/100 × 200 = 30
So, 15% of 200 is 30.
2. One-variable Data: Distributions
Understanding how data is spread out is critical here. You may be asked to interpret graphs like histograms.
Example: If a histogram shows that 30 students scored between 70 and 80 on a test and 40 students scored between 80 and 90, you may be asked to compare these groups.
Graph interpretation questions often require you to analyze the spread of data in different ranges.
3. One-variable Data: Measures of Center and Spread
You’ll need to calculate the mean, median, mode, and sometimes the range.
Example: Find the median of the data set: 3, 5, 7, 8, 12.
Solution: Arrange the numbers in order (which they already are) and pick the middle one: the median is 7.
4. Two-variable Data: Models
This concept involves analyzing the relationship between two variables, typically represented in a scatterplot or graph. You’ll need to determine trends or correlations.
Example: The number of hours studied (x) and the test scores (y) of 5 students are plotted on a scatterplot. You may need to describe the trend or fit a linear model to the data. A positive trend shows that as hours increase, scores tend to increase.
5. Two-variable Data: Scatterplots
Scatterplots show the relationship between two variables. You’ll be asked to find patterns or interpret correlations.
Example: Given a scatterplot showing age vs. income, you may be asked to identify whether there’s a positive, negative, or no correlation.
Graph Example for Scatterplot Interpretation
Let’s create a simple scatterplot showing a positive correlation between hours studied and test scores.
Scatterplot: Hours Studied vs. Test Scores
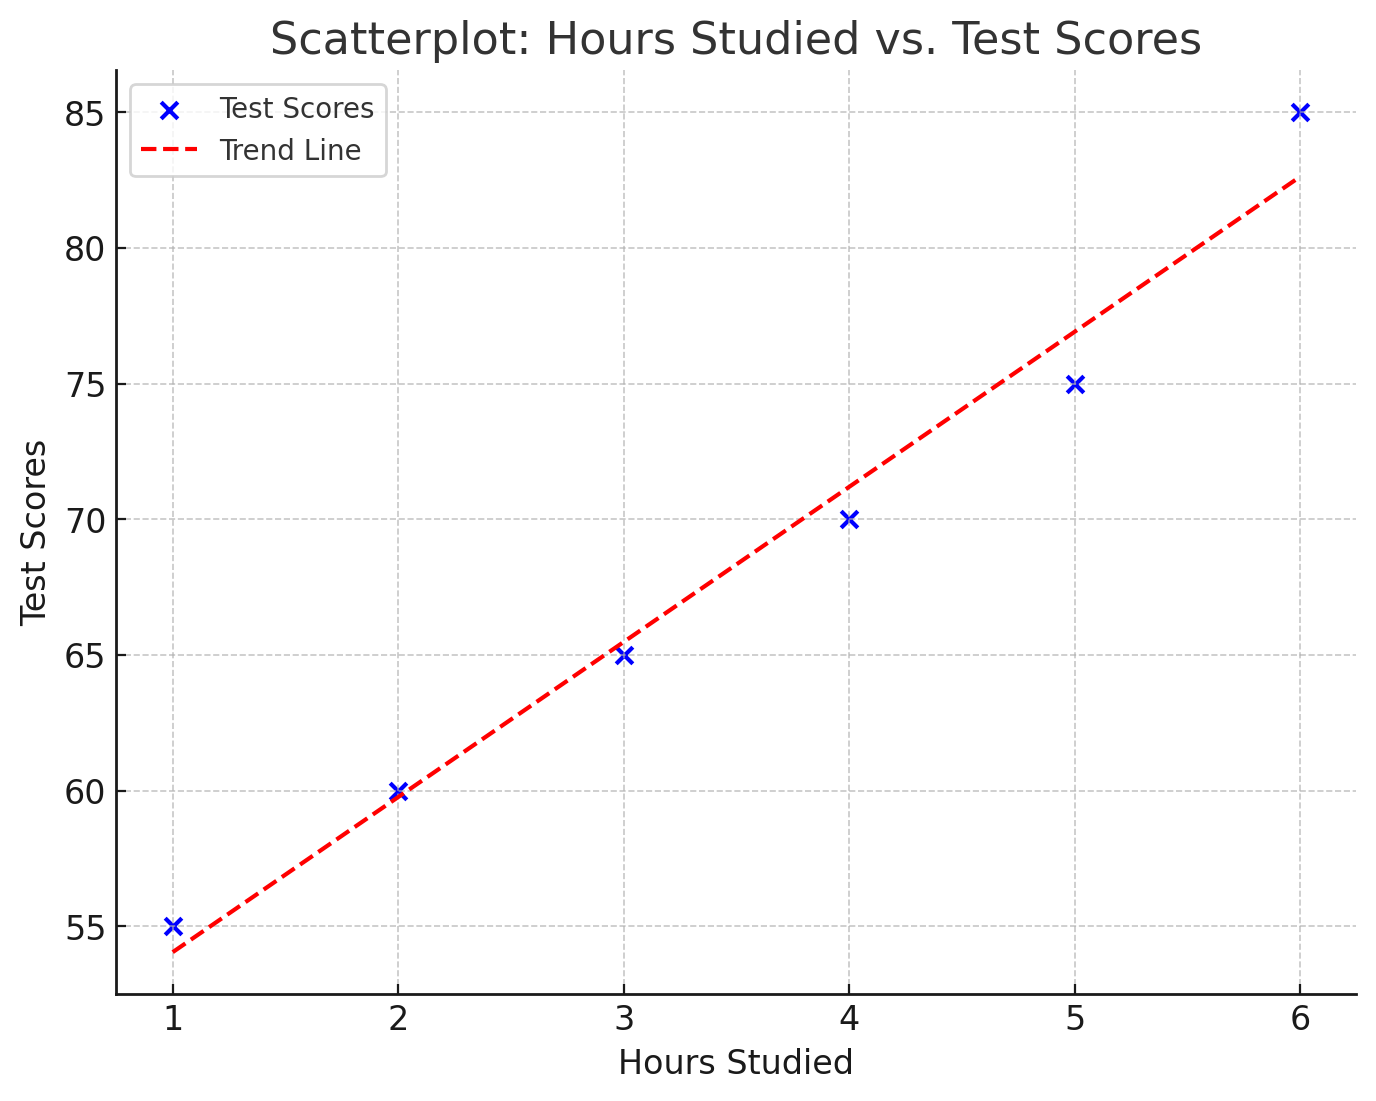
Here is a scatterplot showing the relationship between hours studied and test scores. As the number of hours studied increases, test scores also tend to rise, indicating a positive correlation. You may encounter similar scatterplot questions on the SAT, where you’ll need to interpret such trends.
6. Probability and Conditional Probability
Probability questions assess how likely an event is to happen. Conditional probability focuses on the likelihood of an event happening, given that another event has already occurred.
Example: If there’s a 60% chance of rain on Monday and a 50% chance of rain on Tuesday, what is the probability that it will rain on both days, assuming the events are independent?
Solution: Multiply the probabilities:
0.6 × 0.5 = 0.3
So, there’s a 30% chance it will rain on both days.
7. Inference from Sample Statistics
These questions test your ability to make predictions or conclusions based on a sample. You’ll need to understand how a sample represents a population and how to infer conclusions based on that data.
Example: A survey shows that 60% of 100 students prefer online classes. What percentage of the entire school population is likely to choose online courses?
Solution: Use the sample to estimate the population preference, likely around 60%, but a margin of error would factor in.
Evaluating Data (2 Concepts)
1. Margin of Error
The margin of error refers to the range of possible errors in survey results. You’ll need to understand how to calculate and interpret it.
Example: If a survey has a margin of error of ±4%, and 56% of people prefer option A, the actual percentage could be between 52% and 60%.
2. Evaluating Statistical Claims
These questions assess whether claims based on data from studies or experiments are valid. You’ll need to distinguish between observational studies and controlled experiments and evaluate the reliability of the data.
Example: A claim states that drinking coffee improves memory based on a small sample size of 10 participants. You’ll need to consider whether the sample size is large enough and whether the study was well-controlled.
Geometry and Trigonometry (15% of Questions)
Geometry and Trigonometry also form a significant portion of the 25 topics tested on the SAT. This domain tests your ability to work with shapes, angles, areas, and trigonometric relationships. Getting comfortable with these formulas and approaches will give you the confidence you need on test day.
2. Volume Calculations
You’ll also be asked to calculate the volume of 3D shapes such as cylinders, spheres, and rectangular prisms.
Formula for Volume of a Cylinder: Volume = πr²h
- r is the radius of the base (variable).
- h is the height (constant).
Example: Find the volume of a cylinder with a radius of 3 units and height of 7 units.
Solution:
Volume = π(3²) x 7 = 63π ≈ 197.92 cubic units
3. Lines, Angles, and Triangles
Questions in this area will test your knowledge of the relationships between angles and sides in triangles, as well as your ability to calculate missing angles.
Example: In a right triangle, if one angle is 30°, what is the measure of the other non-right angle?
Solution: Since the sum of angles in any triangle is 180°, the second angle is:
90° − 30° = 60°
So, the other angle is 60°.
4. Circles
You’ll need to know how to calculate the circumference and area of circles.
Formulas: Circumference = 2πr, Area = πr²
- r is the radius (variable).
Example: Find the circumference and area of a circle with a radius of 4 units.
Solution:
Circumference = 2π × 4 = 8π ≈ 25.13 units
Area = π × 4² = 16π ≈ 50.27 square units
Trigonometric Applications (3 Concepts)
1. Right Triangles and Trigonometry
Right triangles are key in trigonometry, and you’ll need to apply the Pythagorean theorem and fundamental trigonometric ratios (sine, cosine, and tangent) to solve these questions.
Pythagorean Theorem: a² + b² = c²
Example: In a right triangle, the two legs are 3 and 4 units long. Find the length of the hypotenuse.
Solution:
3² + 4² = c²
9 + 16 = c²
c = √25
c = 5
2. Trigonometric Ratios
These ratios relate the angles of a right triangle to the lengths of its sides.
Formulas: sin 𝜃 = opposite/hypotenuse, cos 𝜃 = adjacent/hypotenuse, tan 𝜃 = opposite/adjacent.
𝜃 = Specific Angle
Example: In a right triangle, if sin 𝜃 = 3/5, what is the value of cos 𝜃?
Solution: Use the Pythagorean identity:
sin² 𝜃 + cos² 𝜃 = 1
Substitue sin 𝜃 = 3/5 :
(3/5)² + cos² 𝜃 = 1
9/25 + cos² 𝜃 = 1
cos² 𝜃 = 16/25
cos² 𝜃 = 4/5
3. Circles and Arcs
In trigonometry, you’ll also encounter questions about arcs, sectors, and their relationship with angles.
Formula for Arc Length: Arc Lenth = 𝜃/360 x 2πr
Example: Find the length of an arc in a circle with a radius of 6 units and a central angle of 60°.
Solution:
Arc Length = 60/360 x 2π x 6
1/6 x 12π = 2π ≈ 6.28 units
A helpful way to remember these relationships is with the acronym SOHCAHTOA:
- Sine equals Opposite over Hypotenuse
- Cosine equals Adjacent over Hypotenuse
- Tangent equals Opposite over Adjacent
This memory trick can be your go-to method for quickly recalling the relationships between the sides of a right triangle and its angles during the SAT.
The Platform Behind LearnQ.ai Is Now Open to You - Start Free
VEGA AI helps institutes create personalized, automated, and scalable test-prep experiences — no coding, no setup hassle.
Conclusion
Mastering the SAT Math section comes down to understanding the key concepts in Algebra, Advanced Math, Problem Solving, Data Analysis, Geometry, and Trigonometry.
Each content domain has its unique focus, but they all share a common goal: testing your ability to apply math in real-world and academic situations.
Whether you’re solving equations, analyzing data, or working with shapes and angles, each of these 25 concepts plays a crucial role in your overall performance.
Quick Tips for Preparation:
- Algebra: Focus on linear equations, systems, and functions. Practice simplifying and solving for variables quickly and accurately.
- Advanced Math: Get comfortable with nonlinear equations and expressions. Know how to factor and solve quadratics and understand how different functions behave.
- Problem Solving and Data Analysis: Work on interpreting graphs, understanding ratios, and solving real-world word problems. Don’t forget to practice your statistical reasoning and basic probability.
- Geometry and Trigonometry: Review the formulas for areas, volumes, and circles. Ensure you know the trigonometric ratios and how to apply them in right triangles.
By focusing on these areas, you’ll be well-prepared to handle the variety of questions in the SAT Math section. Consistent practice and a good understanding of these core concepts will help you confidently navigate the test.
Remember, preparation is about building familiarity and speed. The more you practice these concepts, the more naturally they’ll come to you when it matters most.
Preparing for the SAT Math section? LearnQ has everything you need to get started. With free diagnostic tests, practice exams, and Mia, the AI tutor, you’ll have personalized guidance to sharpen your math skills.
Whether you’re aiming for a higher score or just beginning your SAT journey, LearnQ is your go-to resource for effective and efficient preparation.
The LearnQ Editorial Team is made up of certified Digital SAT tutors, college admissions specialists, and AI education researchers. Our tutors have personally helped over 10,000 US high school students improve their SAT scores, with an average improvement of 150+ points. We combine hands-on tutoring expertise with AI-powered insights from the LearnQ platform, which has analyzed millions of Digital SAT practice questions. Every article we publish is reviewed against the latest College Board Bluebook guidelines and cross-checked with real student performance data. Our mission is simple: give every student the same quality of prep that was once only available at expensive tutoring centers.