SAT scores are often a critical component in the college admissions process, serving as a key indicator of a student’s academic abilities. They serve as a standard measure of a student’s readiness, letting colleges fairly compare candidates from different schools and backgrounds.
A high SAT score makes an application stand out in the competitive atmosphere of selective colleges, where top scores are often expected. Beyond admissions, these scores can also sway decisions on scholarships, potentially reducing the financial strain of college.
Whether you’re a student, teacher, or parent, understanding the March SAT score release and the March SAT curve is crucial. These factors heavily influence educational tactics and expectations around college entry. This blog breaks down the scoring process and the role of the curve, offering key insights for effective prep and planning.
LearnQ.ai is Powered by VEGA AI—Is your Institute Next?
Give students a Duolingo-style test-prep platform with Shopify-level customization for tutors and institutes.
What is the March SAT Curve?
In the context of the SAT, the term “curve” often leads to misconceptions. Unlike traditional grading curves used in classrooms, where students’ scores are adjusted based on their peers’ performance, the SAT employs a process known as equating. This process ensures that scores reflect the same level of ability regardless of variations in test difficulty across different administrations. The College Board, which administers the SAT, uses statistical methods to adjust raw scores (the number of correct answers) into scaled scores (ranging from 200 to 800 for each section) to maintain consistency and fairness in scoring.
Example of How the March SAT Curve Works
To illustrate how equating works, consider two hypothetical versions of the SAT Math section:
- Test A: Easier questions result in a raw score of 50, which translates to a scaled score of 750.
- Test B: Slightly more complicated questions mean that a raw score of 50 would only translate to a scaled score of 730.
In this example, if a student answers 50 questions correctly on both versions, their performance would be evaluated differently based on the difficulty of each test. The equating process adjusts for these differences so that achieving a score of 750 on Version A reflects similar proficiency as achieving a score of 730 on Version B. This ensures that all students have an equal opportunity to demonstrate their knowledge and skills, regardless of which version they take.
While there is no traditional “curve” affecting individual scores based on peer performance, understanding the SAT’s equating process is essential for interpreting scores accurately and preparing effectively for the exam.
Why Understanding the SAT Curve Matters for Students and Educators
| Factor | Importance for Students | Importance for Educators |
| Fairness Across Test Dates | Ensures that students’ scores are fair and comparable, regardless of the test version’s difficulty or administration date. | Allows educators to accurately assess and compare performance over time and across different cohorts of students. |
| SAT Score Interpretation | It helps students understand their performance in context, not just as a raw score but in a manner that reflects the test’s relative difficulty. | It provides a basis for educators to give more nuanced feedback and guidance based on scores that account for test difficulty. |
| Test Preparation | Enables students to strategise their study plans according to insights from previous curves, focusing on areas likely to impact their scaled score. | Assists educators in designing preparation materials and practice tests that mimic actual testing conditions and scoring adjustments. |
Enhance your Digital SAT study routine with AI-driven insights and personalized practice tests.
Understanding SAT Scores Release Timeline
Understanding when SAT scores are released helps students plan their next steps in the college admissions process. Knowing the timeline allows for better preparation in case of retakes and provides a clear schedule for submitting scores to colleges.
March SAT Release Dates
For the March 2025 SAT, the scores are typically released on the following dates:
| SAT Test Date | SAT Score Release Dates | Colleges Receive Scores |
| March 8, 2025 | March 21, 2025 | March 31, 2025 |
This pattern indicates that students can expect to view their scores approximately 13 days after taking the test, while colleges will receive these scores about 10 days after students do.
How Scores Are Processed
The scoring process for the SAT involves several vital steps to ensure accuracy and fairness:
- Initial Scoring: After the test is administered, each student’s responses are scored. The raw score is calculated based on the number of correct answers, with no penalty for incorrect answers.
- Verification: The College Board conducts a verification process to ensure that all answers have been accurately scored. This may include double-checking responses and ensuring that scoring algorithms are correctly applied.
- Equating Process: To account for variations in test difficulty across different administrations, the College Board uses a statistical method known as equating. This process adjusts raw scores to ensure that a given score reflects the same level of proficiency regardless of when or which version of the test was taken.
- Final Score Reporting: Once scores have been verified and adjusted, they are compiled into a report that includes total scores, section scores (for Evidence-Based Reading and Writing and Math), subscores, and percentile ranks. These reports are then made available to students online and sent to designated colleges.
Understanding this timeline and scoring process is essential for students as they prepare for college admissions. It allows them to plan accordingly based on when they can expect their results.
How the SAT Curve Works
The SAT curve exists to level the playing field, accounting for variations in test difficulty across different administrations. By adjusting scores through this curve, the SAT ensures that a student’s performance is measured fairly, no matter which version of the test they take.
Explanation of Score Adjustments
The SAT employs a method known as equating to adjust raw scores into scaled scores, ensuring fairness and consistency across different test administrations. Here’s how this process works:
1- Raw Score Calculation: Each student’s raw score is calculated based on the number of correct answers, with no penalties for incorrect or unanswered questions.
2- Equating Process: After each test administration, the College Board analyses the performance data to assess the difficulty level of that particular test. This analysis involves:
- Statistical Modeling: The College Board uses statistical models to compare raw scores from different test versions. If one test is determined to be more accessible, adjustments are made so that students receive higher scaled scores for the same raw score compared to a more complex version.
- Adjustment of Raw Scores: For example, if a student answers 45 questions correctly on a more accessible version, their raw score might convert to a scaled score of 700. On a more complicated version, the same raw score might yield a scaled score of 680.
3- Final Scaled Score Reporting: Once raw scores are adjusted through equating, they are reported as scaled scores (200-800) for each section (Evidence-Based Reading, Writing, and Math).
Factors Influencing the Curve
Several key factors influence how the SAT curve is established:
- Test Difficulty: Variations in question difficulty directly impact how raw scores are converted into scaled scores. A test with more challenging questions will require adjustments to ensure that students are not unfairly penalised.
- Student Performance Levels: The overall performance of all students taking a particular test can indicate its difficulty. If many students achieve high scores, it may suggest that the test was easier than usual, leading to adjustments in scoring.
- Historical Data: The College Board also considers historical performance data from previous administrations to inform their equating process. This helps maintain consistency in scoring standards over time.
By understanding these processes and factors, students can better grasp how their SAT scores reflect their abilities and how they compare with peers across different testing conditions. This knowledge can also guide their preparation strategies for the exam.
Impact of the Curve on Individual Scores
Understanding the Impact of the SAT score curve on individual scores is crucial, as it ensures that all students are evaluated fairly, regardless of the specific test version they take. By adjusting scores based on test difficulty, the curve helps create a level playing field for everyone.
How Scores Are Affected:
The SAT scoring curve can significantly influence individual scores depending on the relative difficulty of the test version taken. This adjustment is essential for maintaining score consistency across different administrations:
- Raising Scores: In scenarios where a particular SAT is tougher than average, the curve can effectively ‘raise’ a student’s score. This means a student might score higher than expected for a given number of correct answers compared to a more straightforward test. For instance, if the test’s math section is unusually challenging, fewer correct answers could still result in a relatively high score.
- Lowering Scores: Conversely, if the test is easier than typical versions, the curve might ‘lower’ scores. This adjustment means students may need to answer more questions correctly to achieve the same score they would have received on a harder test. For example, achieving a perfect score might require absolute precision without any room for error.
Comparison of SAT Score Curves (2018-2024)
| Test Date | Raw Score (Correct Answers) | Scaled Score (Easier Version) | Scaled Score (Harder Version) | Comments |
| May 2018 | 45 | 730 | 670 | A significant drop in scores was noted after June 2018. |
| June 2018 | 45 | 750 | 680 | Controversial curve; less generous scoring. |
| March 2019 | 45 | 740 | 690 | It’s slightly easier than June; more favourable adjustments. |
| October 2019 | 45 | 735 | 685 | Similar difficulty to March; stable scoring. |
| March 2020 | 45 | 720 | 675 | Return to tighter scoring; reflects harder questions. |
| August 2021 | 45 | 740 | 700 | Easier versions led to higher-scaled scores. |
| March 2022 | 45 | 730 | 680 | Consistent with previous trends, slight tightening was noted. |
| March 2023 | 45 | 735 | 690 | Similar scoring patterns were observed, with slight variability. |
| March 2024 | 45 | TBD | TBD | Awaiting data for this administration; expected trends to continue. |
Strategies for SAT Preparation
Effective SAT preparation hinges on strategic practice and familiarity with the test format. Here are some approaches to consider for preparing for SAT scores:
1- Thorough Material Review:
Purpose: This ensures a deep understanding of all potential content areas, helping students handle the varying difficulties of different test versions.
Approach: Focus on reviewing key concepts in math, critical reading, and writing. Utilise resources like SAT prep books, online tutorials, and study guides to reinforce learning.
2- Practice with Official College Board SAT Questions:
Purpose: Official practice questions are the best way to experience the types of questions that will appear on the actual test.
Approach: Use the College Board’s SAT practice materials, including their practice tests and sample questions. These resources provide the most accurate representation of the questions you’ll face, including their format and difficulty.
3- Timed Practice Tests on Platforms like LearnQ.ai:
Purpose: Practicing under timed conditions is crucial for adapting to the SAT’s pacing and ensuring students can manage their time effectively during the actual test.
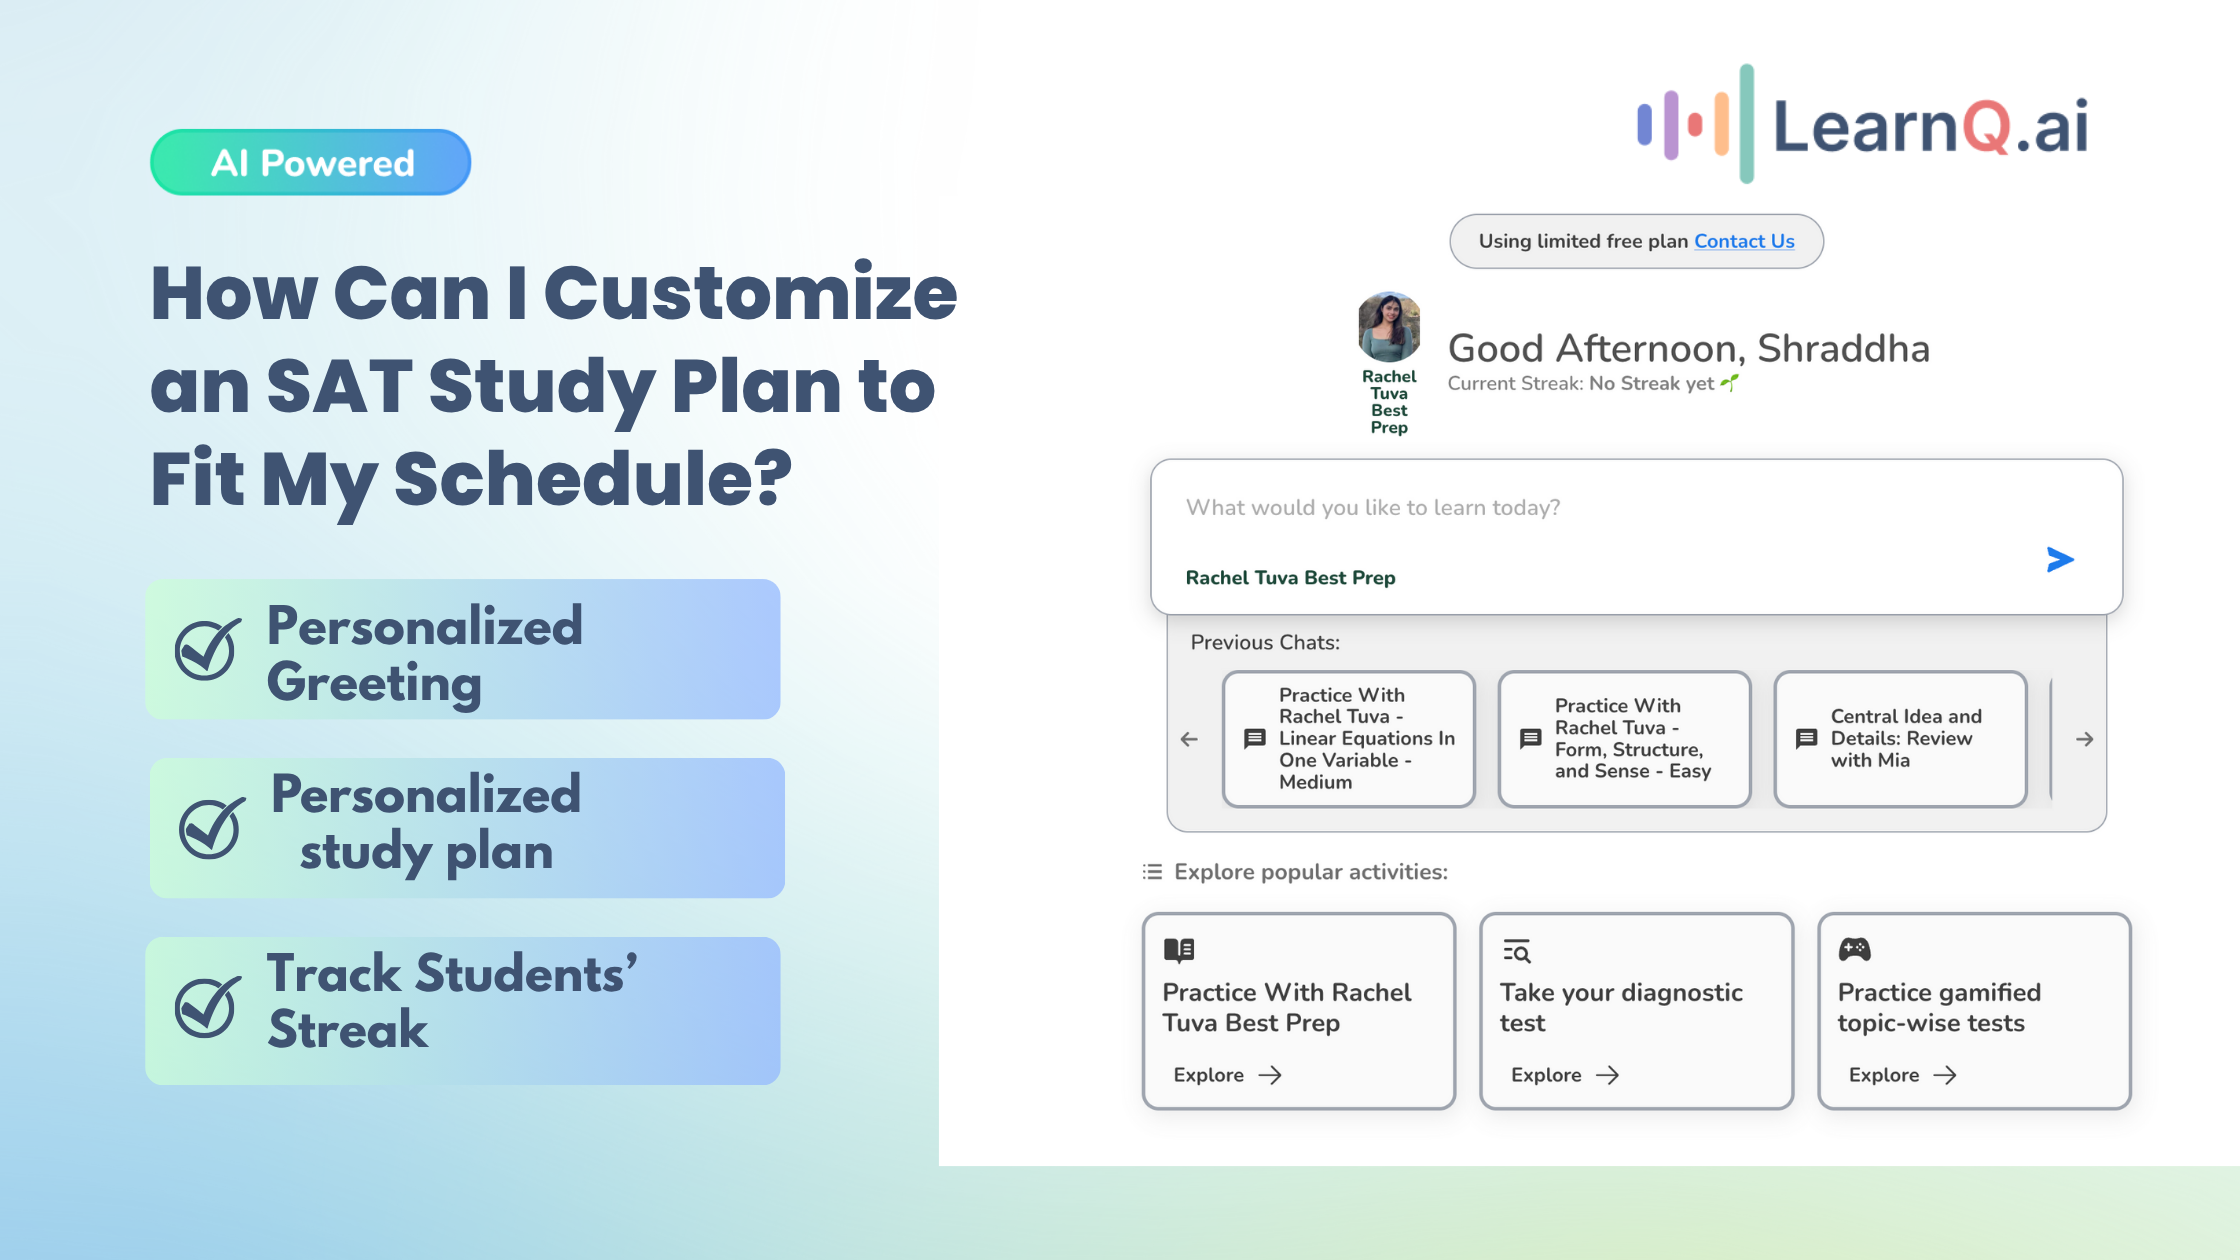
Approach: LearnQ.ai provides a realistic, adaptive test environment with detailed analytics and engaging gamified elements, helping students target their efforts and build confidence.
- Simulated Test Environment: LearnQ.ai provides full-length SAT practice tests that closely mimic the format and timing of the actual exam. This simulation helps you become accustomed to the test’s structure and pacing, reducing anxiety on test day.
- Adaptive Learning Technology: The platform employs AI-driven adaptive learning, adjusting the difficulty of questions based on your performance. This personalised approach ensures that you are consistently challenged at an appropriate level, promoting effective learning and improvement.
- Detailed Performance Analytics: After completing each practice test, LearnQ.ai offers in-depth analytics, highlighting your strengths and areas needing improvement. These insights enable you to focus your study efforts more efficiently, targeting specific topics or question types that require attention.
- Gamified Learning Experience: To make studying more engaging, LearnQ.ai incorporates gamified elements into its practice tests. This approach not only makes learning more enjoyable but also enhances retention and motivation.
By integrating these targeted strategies into your SAT prep, you can improve both your knowledge base and your ability to perform under exam conditions, boosting your confidence and potential scores.
Also Read Strategic Steps, Tips, & Templates For Effective Lesson Planning.
Getting Ready for SAT Score Release: What to Do and How to Interpret Your Results
Waiting for SAT scores can be a stressful experience for students. However, there are proactive steps that can help manage this waiting period and prepare for interpreting the results once they are released.
Enhance your Digital SAT study routine with AI-driven insights and personalized practice tests.
Actionable Tips While Waiting for Your SAT Scores
- Stay Engaged in Learning: Continue studying, focusing on areas where you feel less confident. This will reinforce your knowledge, whether for a retake or college-level courses.
- Plan for Next Steps: Research colleges and their SAT score requirements to set realistic goals and timelines for applications.
- Discuss with Educators or Counselors: Talk to teachers or counsellors about your performance. They can offer guidance on interpreting your scores and planning your next steps.
- Practice Stress-Relief: Engage in activities like exercise or meditation to manage anxiety while waiting for results.
- Prepare Application Materials: Work on your personal statement, letters of recommendation, and extracurricular summaries. This will help streamline the application process later.
Understanding the Results: Guide on interpreting scores once released.
Once your SAT scores are released, here’s how to interpret them effectively:
- Review Your Score Report: Check your total score, section scores (Evidence-Based Reading and Writing, Math), subscores, and percentile ranks to see where you did well and where you can improve.
- Understand Scaled Scores: The SAT scores range from 400 to 1600, with each section between 200 and 800. Compare your scores to college requirements to assess your competitiveness.
- Check Percentile Ranks: This shows how you performed relative to other test-takers. A 75th percentile rank, for example, means you scored better than 75% of students.
- Analyse Subscores: Subscores break down specific skills within sections (e.g., command of evidence, algebra). Use them to pinpoint strengths and areas for improvement.
- Consider Retaking the SAT: If needed, assess which areas require focus and develop a targeted plan before retaking the test.
By using these tips, students can gain clarity on their performance and confidently plan their next steps in the college admissions process.
LearnQ.ai is powered by VEGA AI—Is your institute next?
Offer students a Duolingo-style test-prep platform with Shopify-level customization for tutors and institutes.


Conclusion
In this article, we’ve explored the essentials of the March SAT curve and score release timeline, giving you the tools to understand how your scores are calculated and what they mean for your college admissions journey. By learning how the curve adjusts for test difficulty, you’re now better prepared to interpret your results and plan your next steps.
With LearnQ.ai, you can prepare more strategically for the SAT. The platform offers tailored study tools, including free diagnostic assessments, timed practice tests, and support from the AI tutor, all designed to strengthen your understanding and boost your confidence.
Ready to optimise your SAT prep? Join LearnQ.ai for customised study support and gain access to tips, encouragement, and resources to help you succeed on your journey to SAT success.

